Data Visualization Is a Product Design Decision
A chart begins with a choice about what someone should be able to see. Before color or layout, there is a unit of comparison, a time window, and a question. Those choices connect data analysis to product design.
My projects move between those two kinds of work. Python and notebooks help me inspect a dataset. An interactive interface lets another person ask their own questions of it. Moving between them requires keeping the meaning of the data intact.
Give an overview somewhere to go
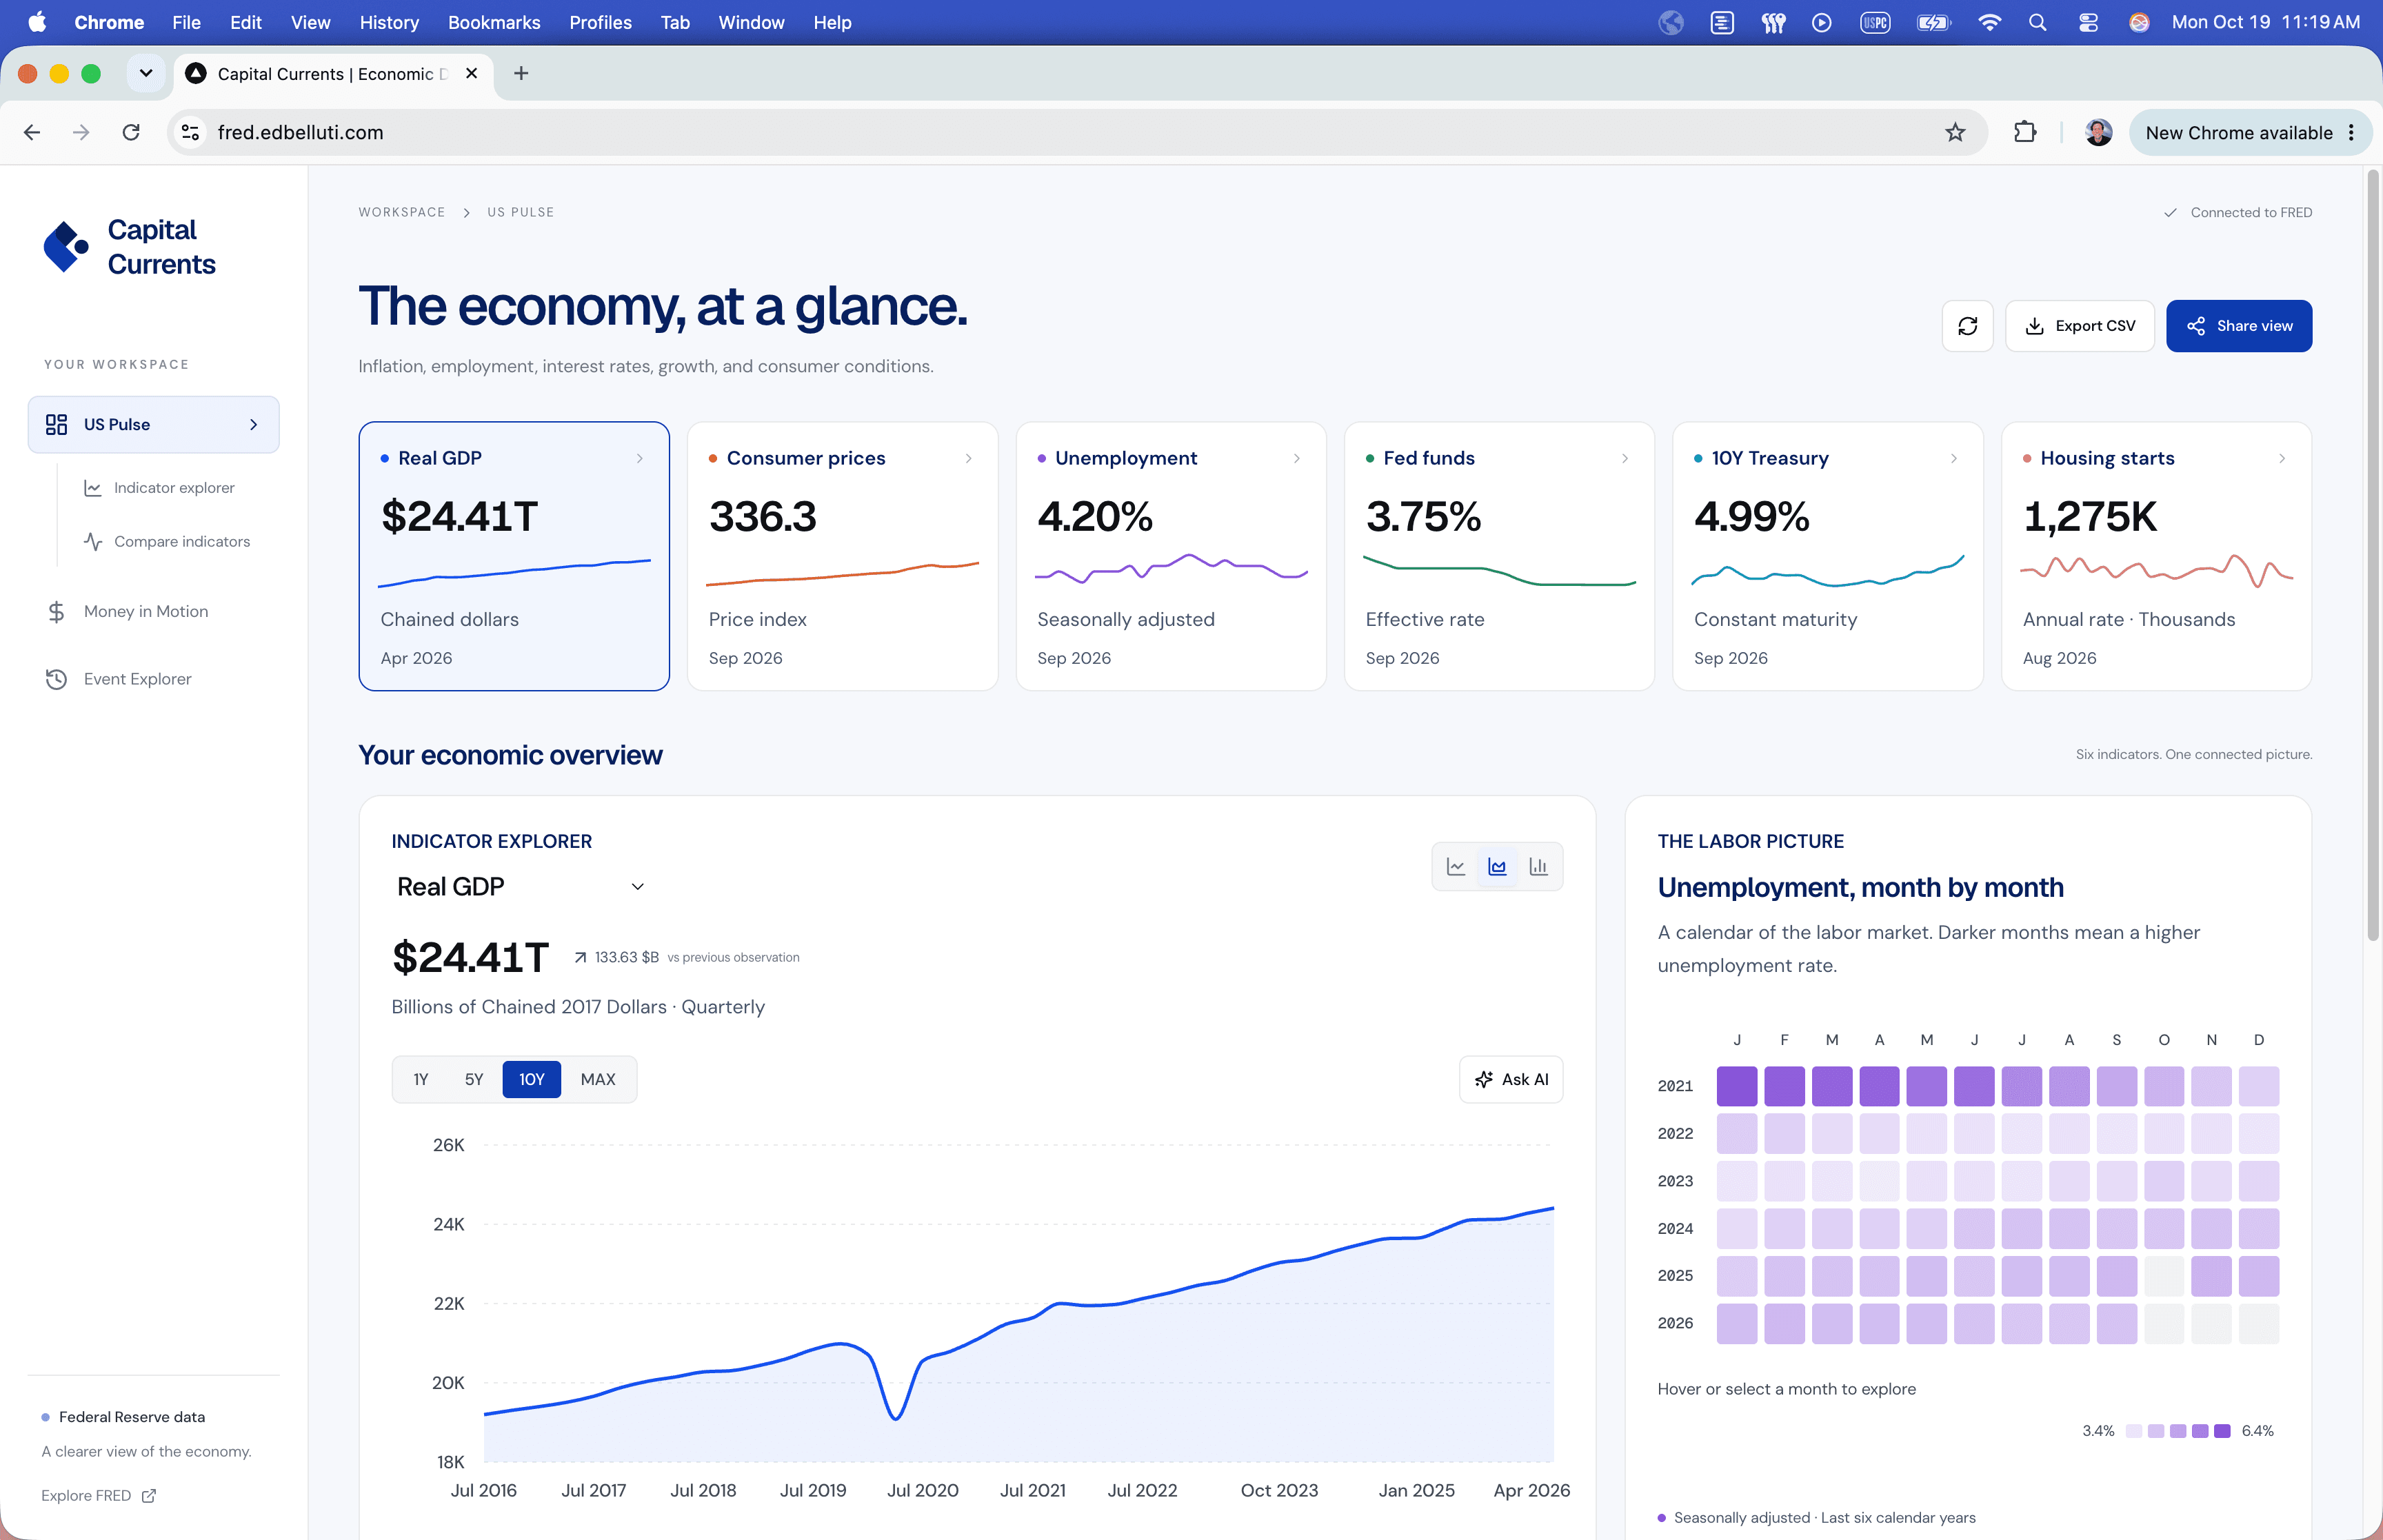
Capital Currents started with US economic indicators and grew into a workspace for exploring prices, trends, and money movement. An overview helps establish the economic picture; individual views make it possible to inspect an indicator more closely.
The interaction matters because the question changes with the time range. A year highlights recent movement. A decade places that movement beside earlier changes. Preserving the selected view in a shareable URL makes the comparison part of a conversation between people.
Explain the transformation
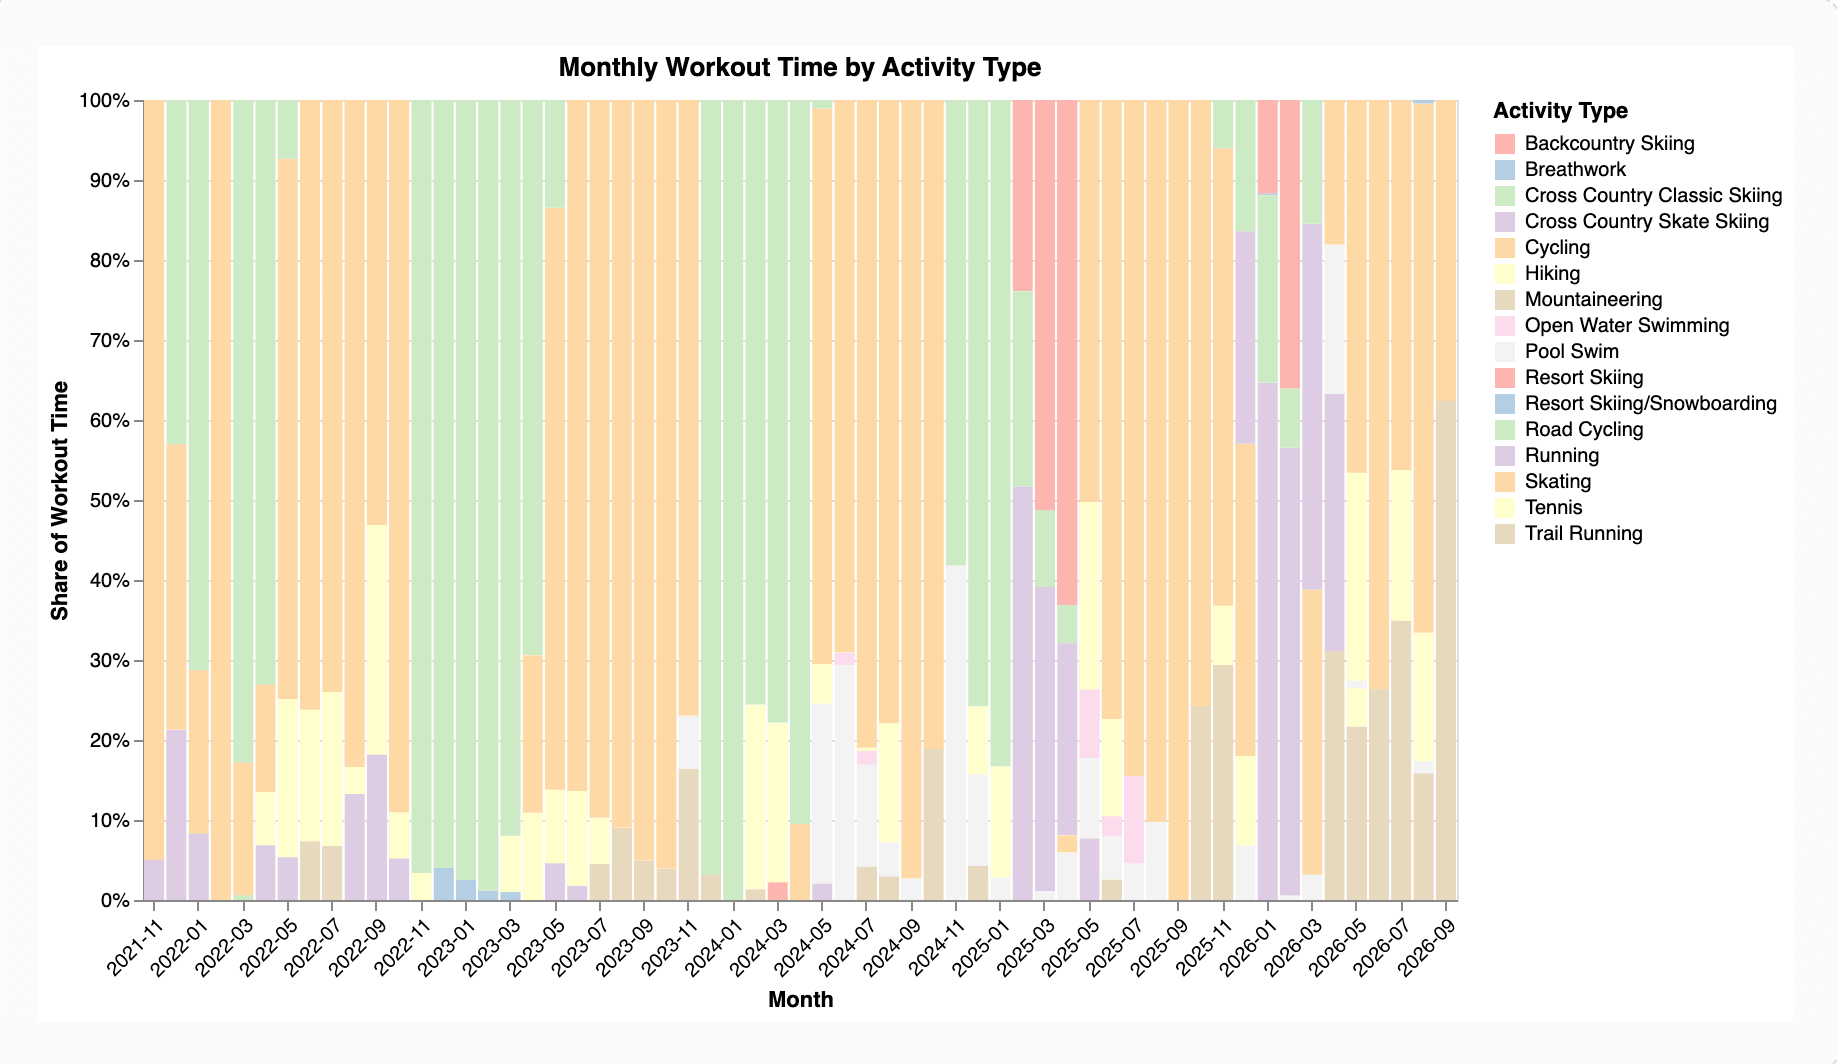
In my Garmin activity analysis, a workout can be an individual observation, a contribution to a monthly total, or part of a distribution. Each view answers a different question. A month with a large share of cycling time does not necessarily contain more total exercise than another month.
That distinction belongs in the interface. Labels, units, tooltips, and explanatory text should make the transformation understandable. Interaction can reveal detail, but it should not be the only way to discover what a measure means.
Let the limits remain visible
Our Data Center Atlas research, completed as part of UC Berkeley's Master of Information and Data Science (MIDS) program, examines data-center growth and the electricity systems around it. Working with country, facility, and grid records makes differences in coverage and measurement consequential.
Estimated facility demand, national averages, and observed correlations have different limits. A useful data product keeps those limits near the finding. It lets a reader distinguish an observation from an explanation of what caused it.
Keep analysis and experience connected
Studying data science at Berkeley has deepened the questions I bring to product work: what is being measured, what was excluded, and which conclusions the evidence can support. My design experience brings another question back to the analysis: what can someone do with this understanding?
That exchange is where I find the work most interesting. A well-designed visualization makes a dataset easier to inspect while leaving room for the person using it to think.
Related: product leadership between design, engineering, and data.
For a facility-level example of explaining numbers, see the PhysaFlow capacity calculator project and how its model assumptions accompany the results.