
Capital Currents: Making Economic Data Useful for Product Teams

Economic conditions shape the products we build. Interest rates influence borrowing costs. Inflation changes purchasing power. Employment affects how people spend and save.
I built Capital Currents to make these relationships easier to explore, with product leaders, engineers, and designers in fintech in mind.
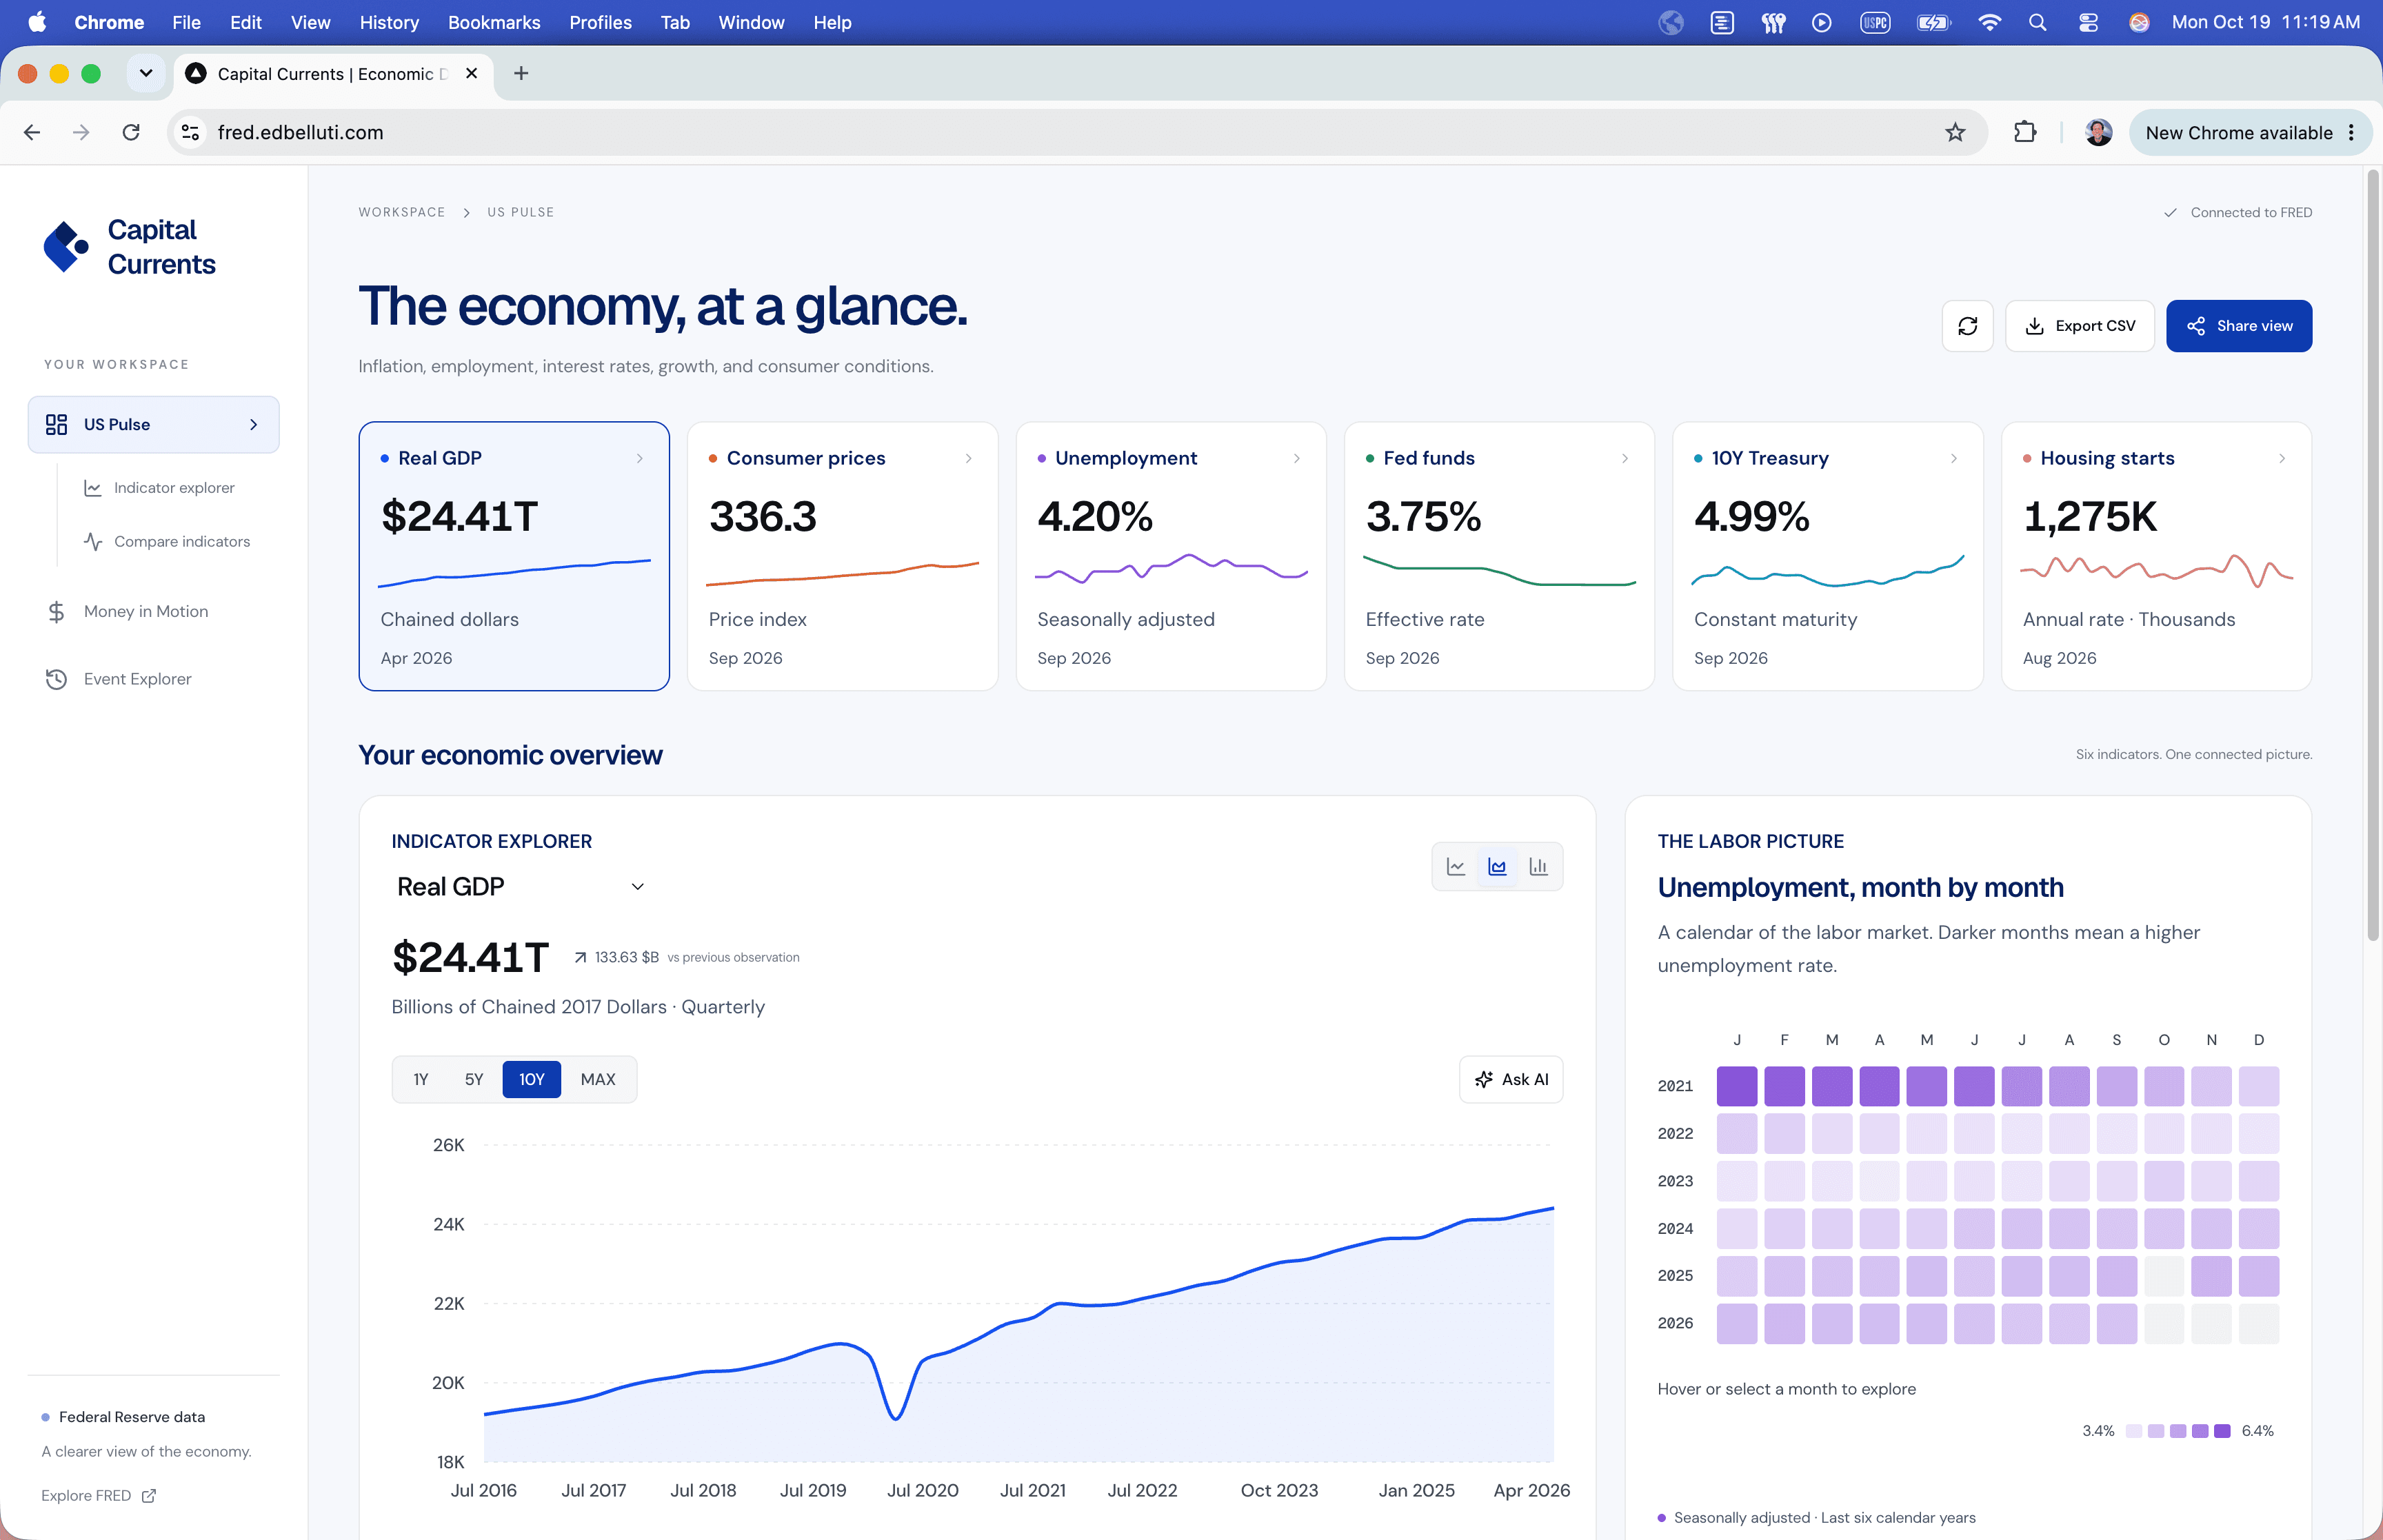
Start with a question
The dashboard brings economic indicators into one workspace. Each offers a different starting point:
- Real GDP: How has economic output changed?
- Consumer prices: How has the price level evolved?
- Unemployment: How has the labor market shifted?
- Federal funds rate: How have monetary conditions changed?
- Housing starts: How has home construction responded?
Switching between a one year view and a ten year view changes the perspective. A recent movement becomes part of a longer pattern.
Design around exploration
The design moves from an economic overview into individual indicators. Charts support closer inspection, while a calendar view makes unemployment patterns visible month by month.
Shareable views preserve the selected indicator, range, and chart type. A product manager can send a colleague the exact GDP view they are discussing.
The underlying data comes from FRED. Units, publication schedules, and revisions matter: a consumer price index measures the price level, while inflation describes its rate of change.
Connect the economy to product questions
For fintech teams, these indicators provide context for questions worth investigating.
How might changing rates affect a borrowing experience? What should a savings product explain about purchasing power? Which assumptions about customer demand deserve another look?
Economic data helps frame those questions. Customer research and product data help answer them.
From the US economy to global money
The next direction is connecting this US overview with currencies and international money movement. I want users to explore how the same economic shift affects someone sending money home, paying an overseas team, or repaying dollar debt.
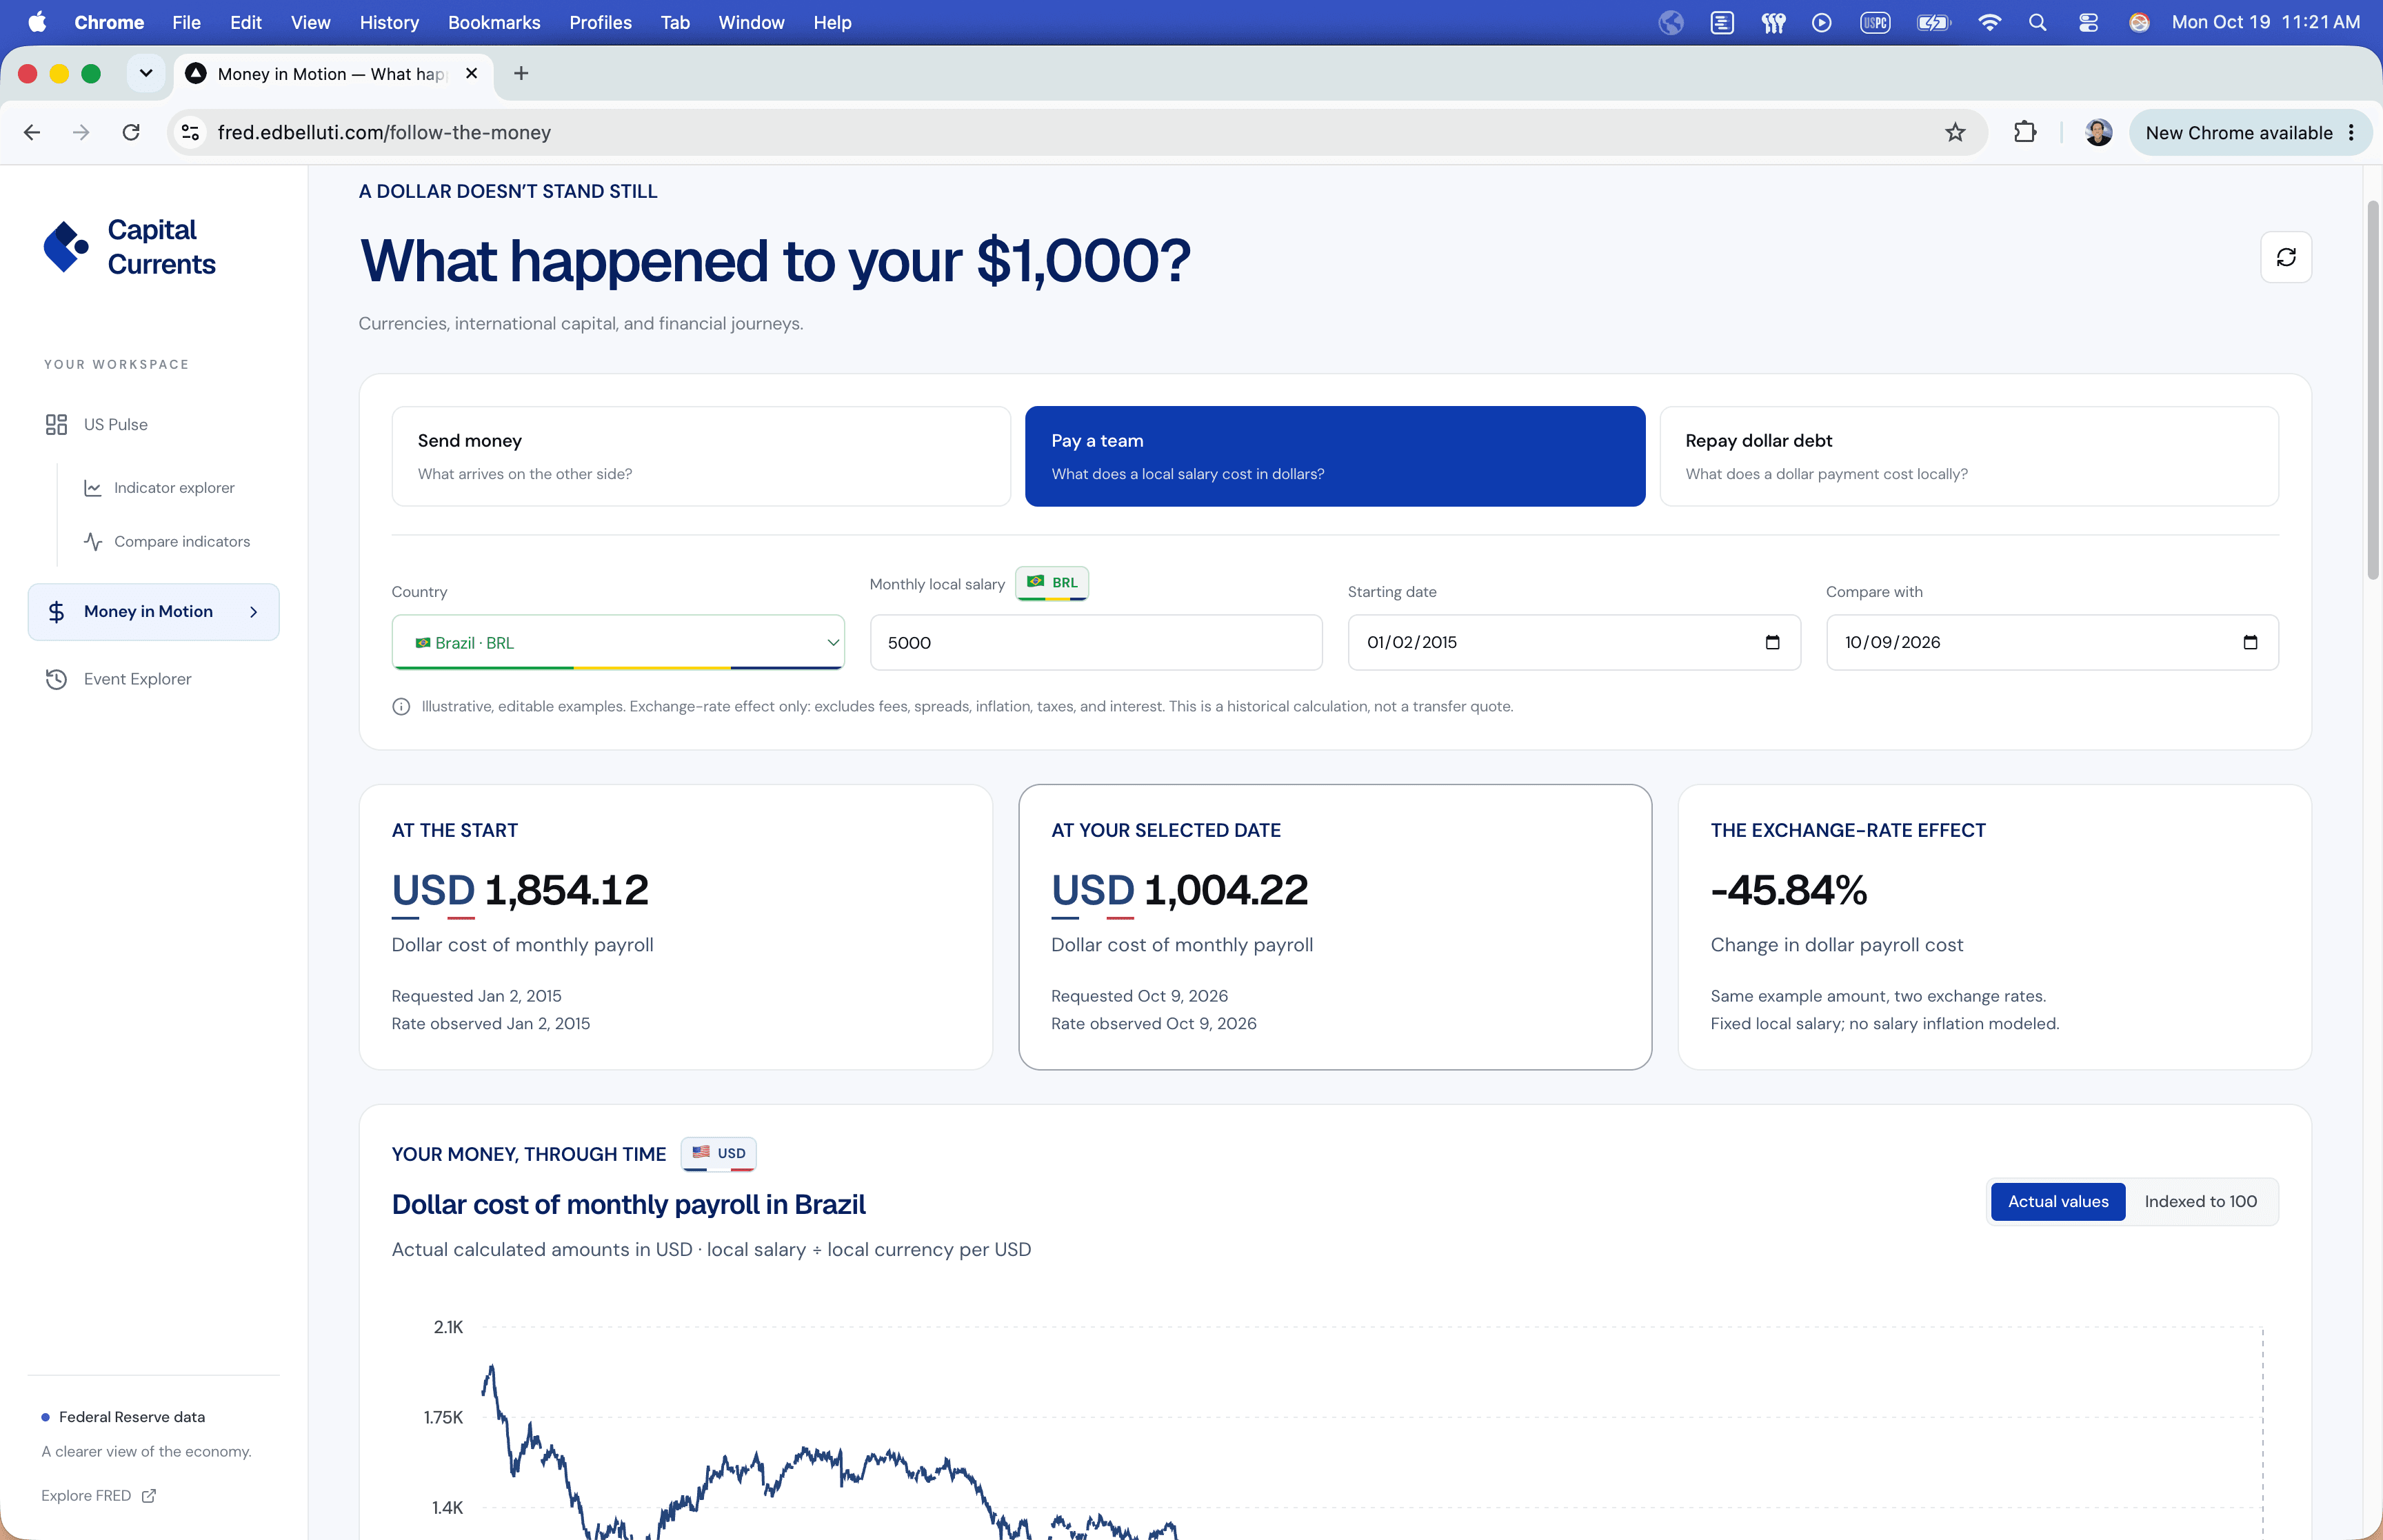
An interactive event timeline will add historical context while keeping observed changes separate from explanations of what caused them.