
Does Data Center Growth Accelerate the Renewable Energy Transition?
Research by Eduardo Belluti, Vladimir Boskovic, Eric Elms, and Cristina Navarro.
A research project completed as part of UC Berkeley's Master of Information and Data Science (MIDS) program.
Artificial intelligence may feel like software, but it depends on physical infrastructure: buildings, servers, cooling systems, transmission lines, and electricity generation. As AI and cloud computing expand, data centers are becoming a significant new source of electricity demand. The question is whether the grids supporting that growth are becoming cleaner quickly enough to keep pace.
I explored this question with Vladimir Boskovic, Eric Elms, and Cristina Navarro as part of UC Berkeley's Master of Information and Data Science (MIDS) program. We combined data-center facility estimates with global power-plant records and Ember electricity data. I later developed the analysis into an interactive web experience that connects the global trends, country-level differences, and U.S. state results.
Explore the interactive Data Center Atlas.
The hypothesis sounded reasonable
Our starting hypothesis was that regions experiencing greater data-center growth might also show stronger renewable-energy adoption. Large facilities create concentrated, long-term demand. In principle, that demand could support new renewable projects, utility investments, and cleaner electricity systems.
The available data cannot establish that data centers cause changes in the generation mix. It can, however, test whether demand growth and renewable progress occur together. We therefore treated the project as an exploratory, correlational analysis rather than a causal study.
Separate renewable growth from renewable share
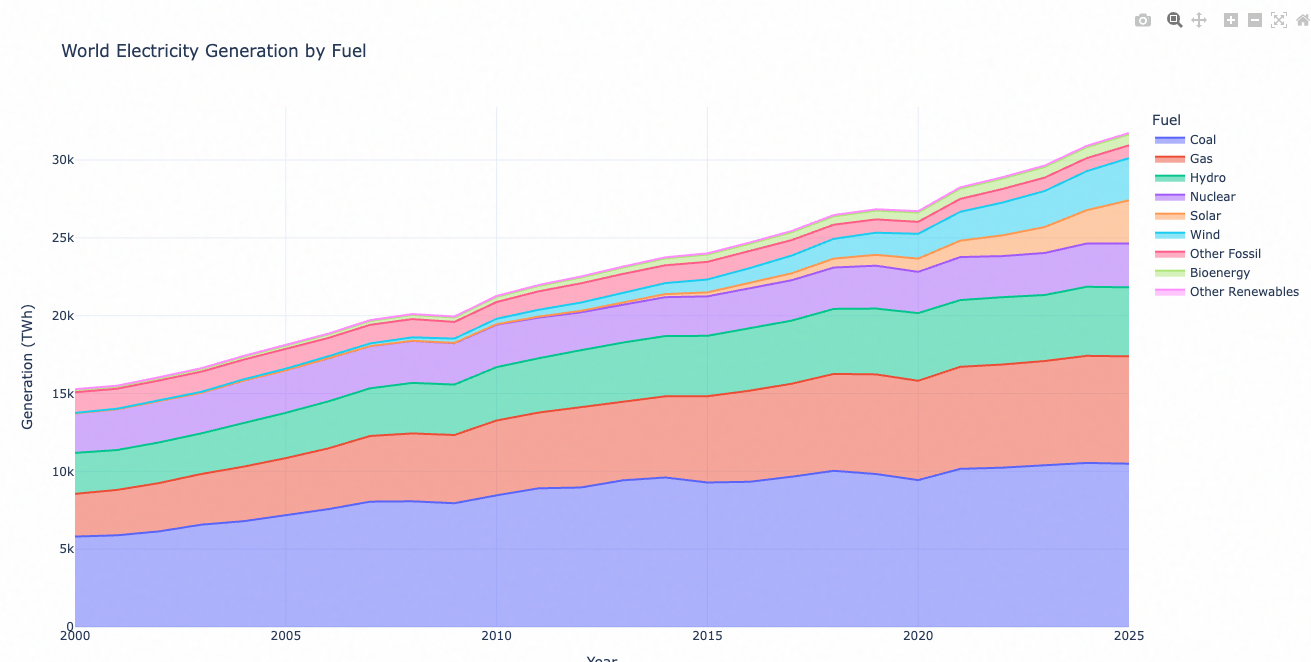
A country can add a large amount of renewable generation while continuing to increase fossil generation. This happens when total electricity demand grows faster than clean supply. Renewable share may improve even though fossil output still rises in absolute terms.
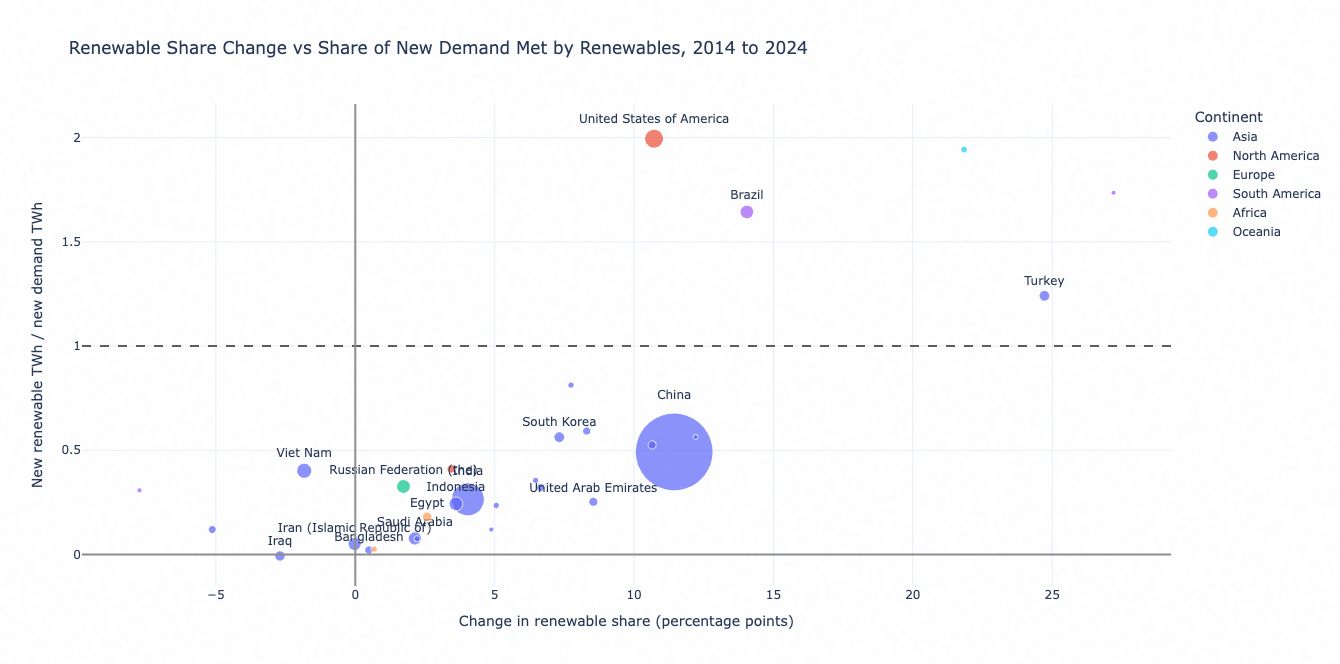
To make this distinction clearer, we used a measure called renewable coverage: renewable generation added divided by total electricity demand added over the same period. A value of 1.0 means renewable additions met all new demand. A value above 1.0 indicates that they also displaced some existing nonrenewable generation.
Demand growth did not predict a faster transition
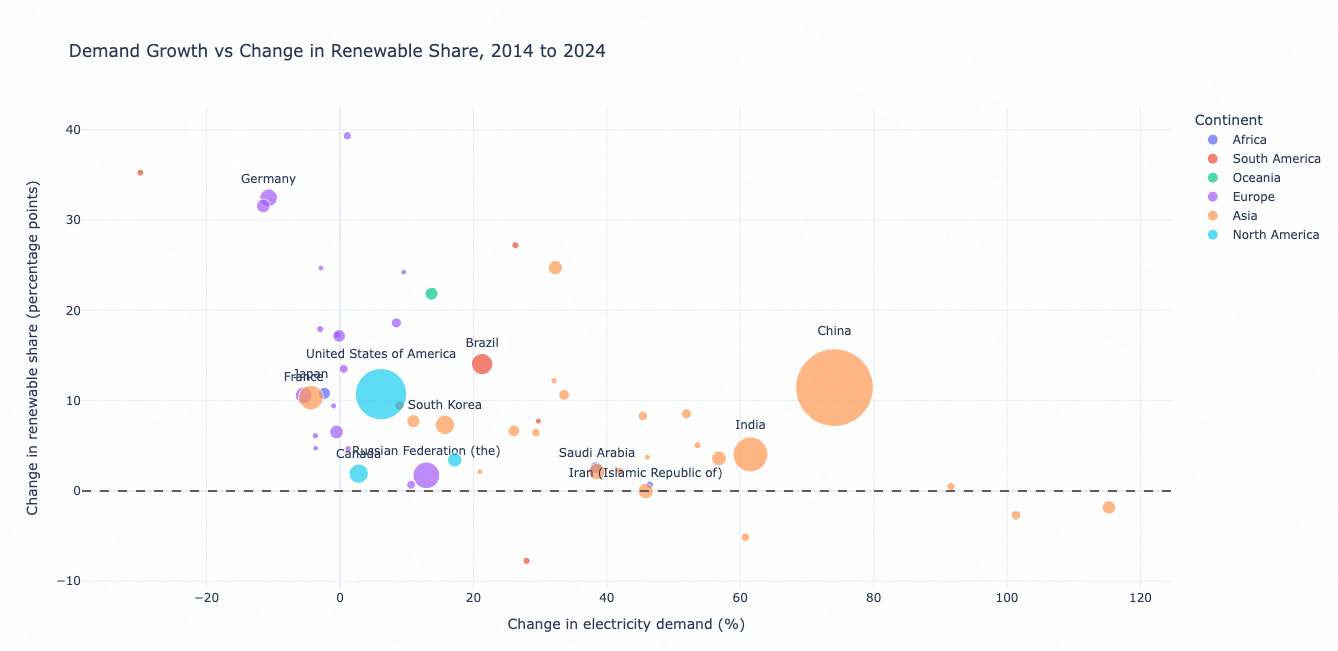
The global results did not support our original hypothesis. Across the sample thresholds we tested, Spearman rank correlations between electricity demand growth and change in renewable share were negative. Countries where demand grew fastest generally recorded smaller improvements in renewable share.
Among the 30 countries with the largest increases in electricity demand, 19 improved their renewable share while also increasing fossil generation. Only six both increased renewable share and reduced fossil output. Renewable capacity was growing, but in many places it was not growing fast enough to produce absolute decarbonization.
The U.S. pattern looks similar
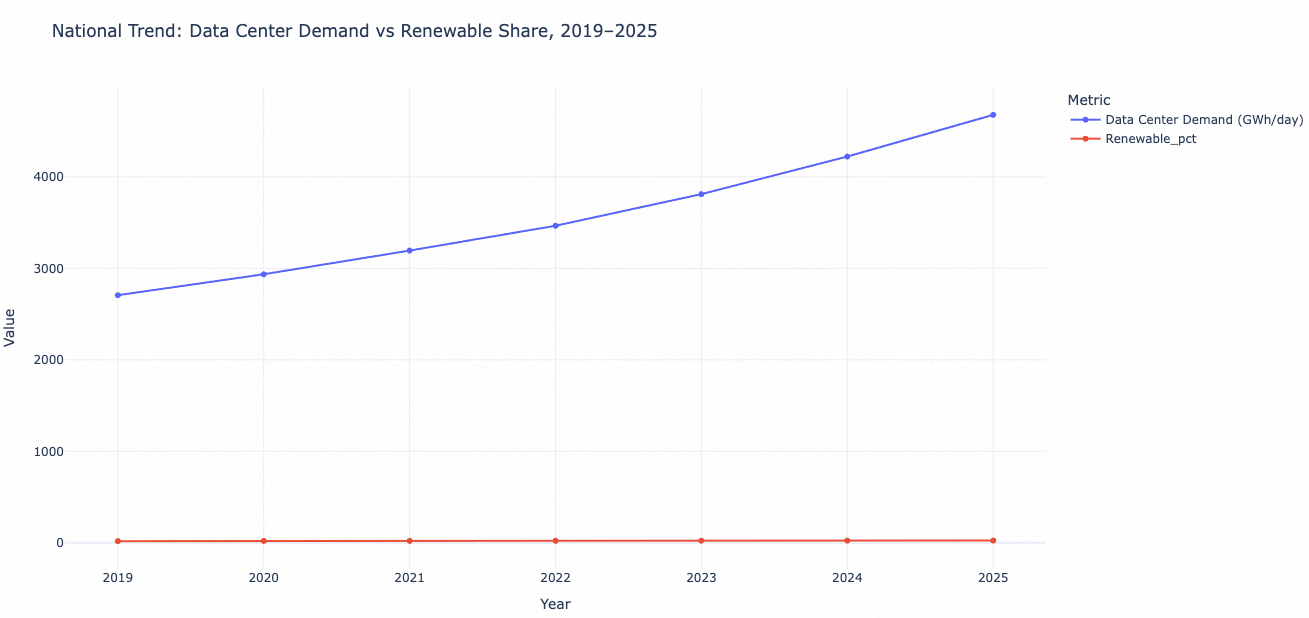
Estimated U.S. data-center electricity demand increased by 72.8 percent between 2019 and 2025. Over the same period, renewable generation share rose by 7.3 percentage points. Both measures moved upward nationally, but parallel trends do not demonstrate that one caused the other.
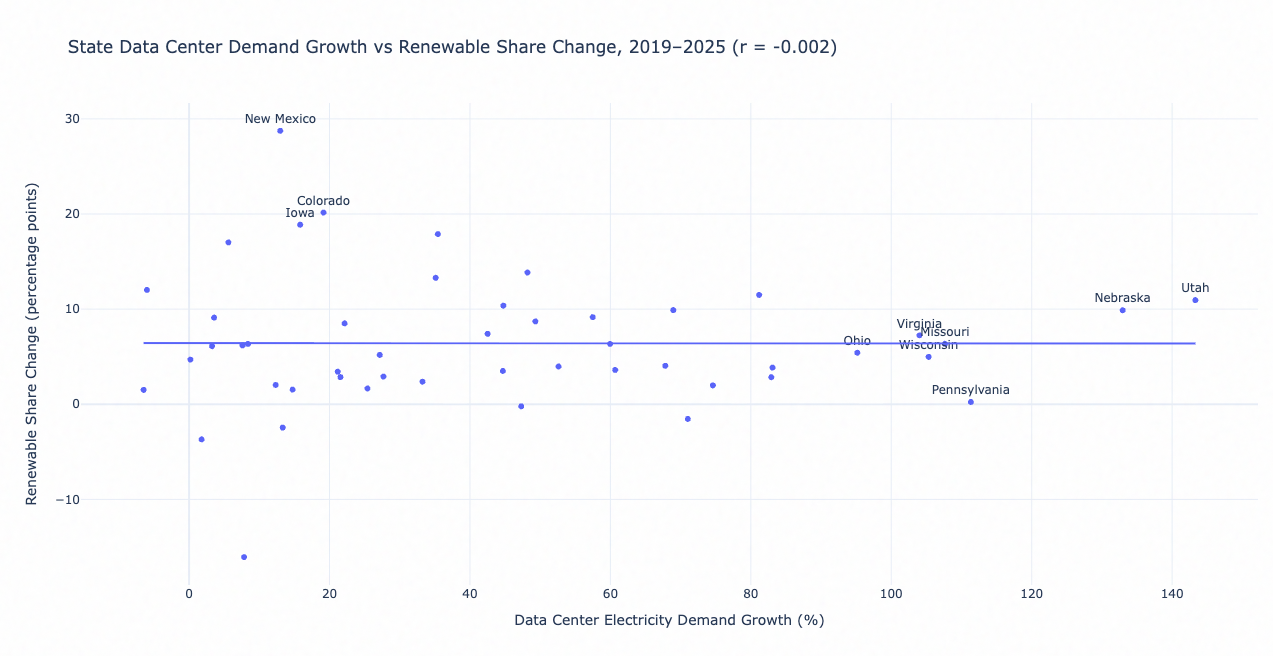
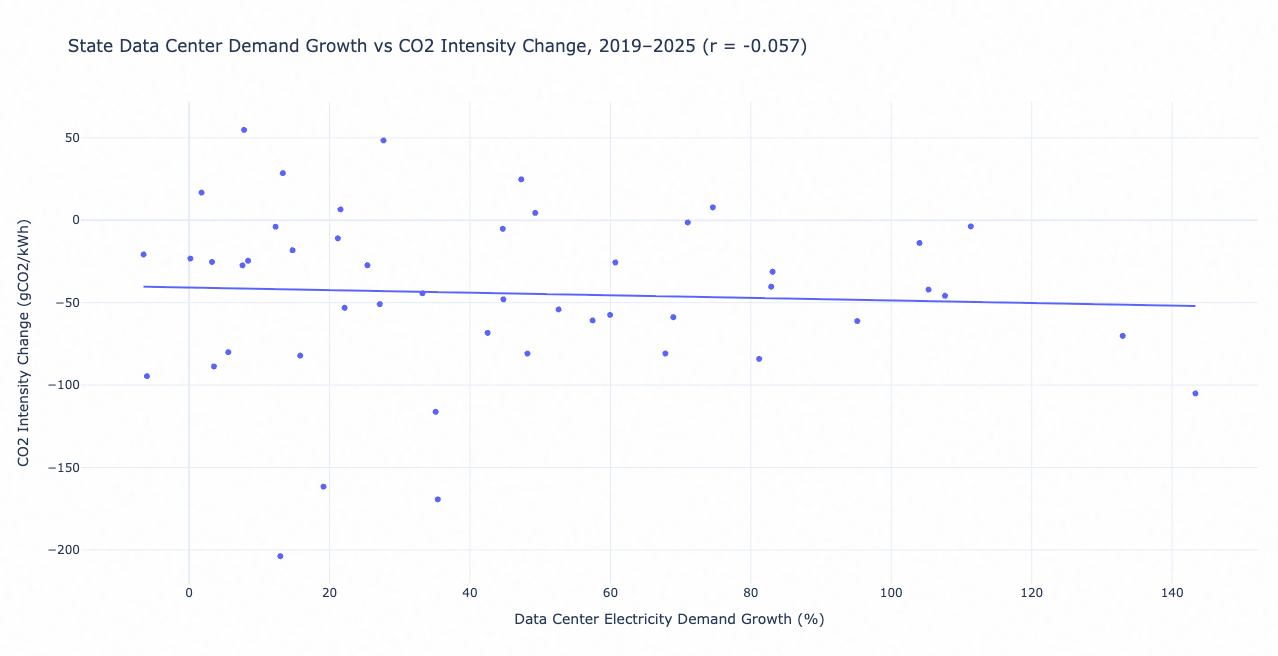
The state-level comparison provided a more useful test. Growth in estimated data-center demand had virtually no linear relationship with renewable-share change (r = -0.002) or carbon-intensity change (r = -0.057). States with faster data-center growth were no more likely to improve those measures than states with slower growth.
Location matters more than the category
A data center is not inherently clean or carbon intensive. Its operational impact depends on the electricity system serving it. The same facility load can produce very different emissions in regions with different generation mixes, transmission constraints, resource availability, and energy policies.
This also means that national averages can hide the most important effects. Data-center development is concentrated in specific utility territories and transmission regions. Country- and state-level data can reveal broad patterns, but evaluating an individual development requires more local information.
What the analysis cannot establish
The facility electricity values are estimates rather than utility-meter observations. Country and state averages hide hourly variation, electricity imports, balancing areas, and local transmission constraints. The analysis also does not directly model utility regulation, public incentives, or corporate energy-procurement agreements.
Most importantly, correlation does not imply causation. The near-zero state relationships do not prove that individual data centers have no effect. They show that data-center growth alone is not a reliable indicator of renewable adoption or declining carbon intensity.
From analysis to an explanatory product
The project became more useful when it moved beyond a notebook. The interactive atlas organizes the analysis as a sequence: establish the scale of the physical infrastructure, examine global demand, distinguish renewable growth from renewable coverage, test the hypothesis, compare geographic readiness, and then narrow the view to the U.S. grid.
That structure reflects how I approach product work. A complex dataset does not become understandable by exposing every metric at once. The interface needs to establish the question, define unfamiliar measures, show the relevant comparison, and keep uncertainty visible. In this case, the most important conclusion is also the simplest: the sustainability of AI depends largely on where its infrastructure is built and how the surrounding electricity system evolves.
Research and project links
Research by Eduardo Belluti, Vladimir Boskovic, Eric Elms, and Cristina Navarro.