
When Photography Becomes Data
A photograph gives a place a face. It holds a particular light, a stretch of road, or a moment that would be easy to miss on a map. But the frame leaves questions open. What surrounds this scene? Which landscape am I traveling through? How does this stop connect to the rest of the journey?
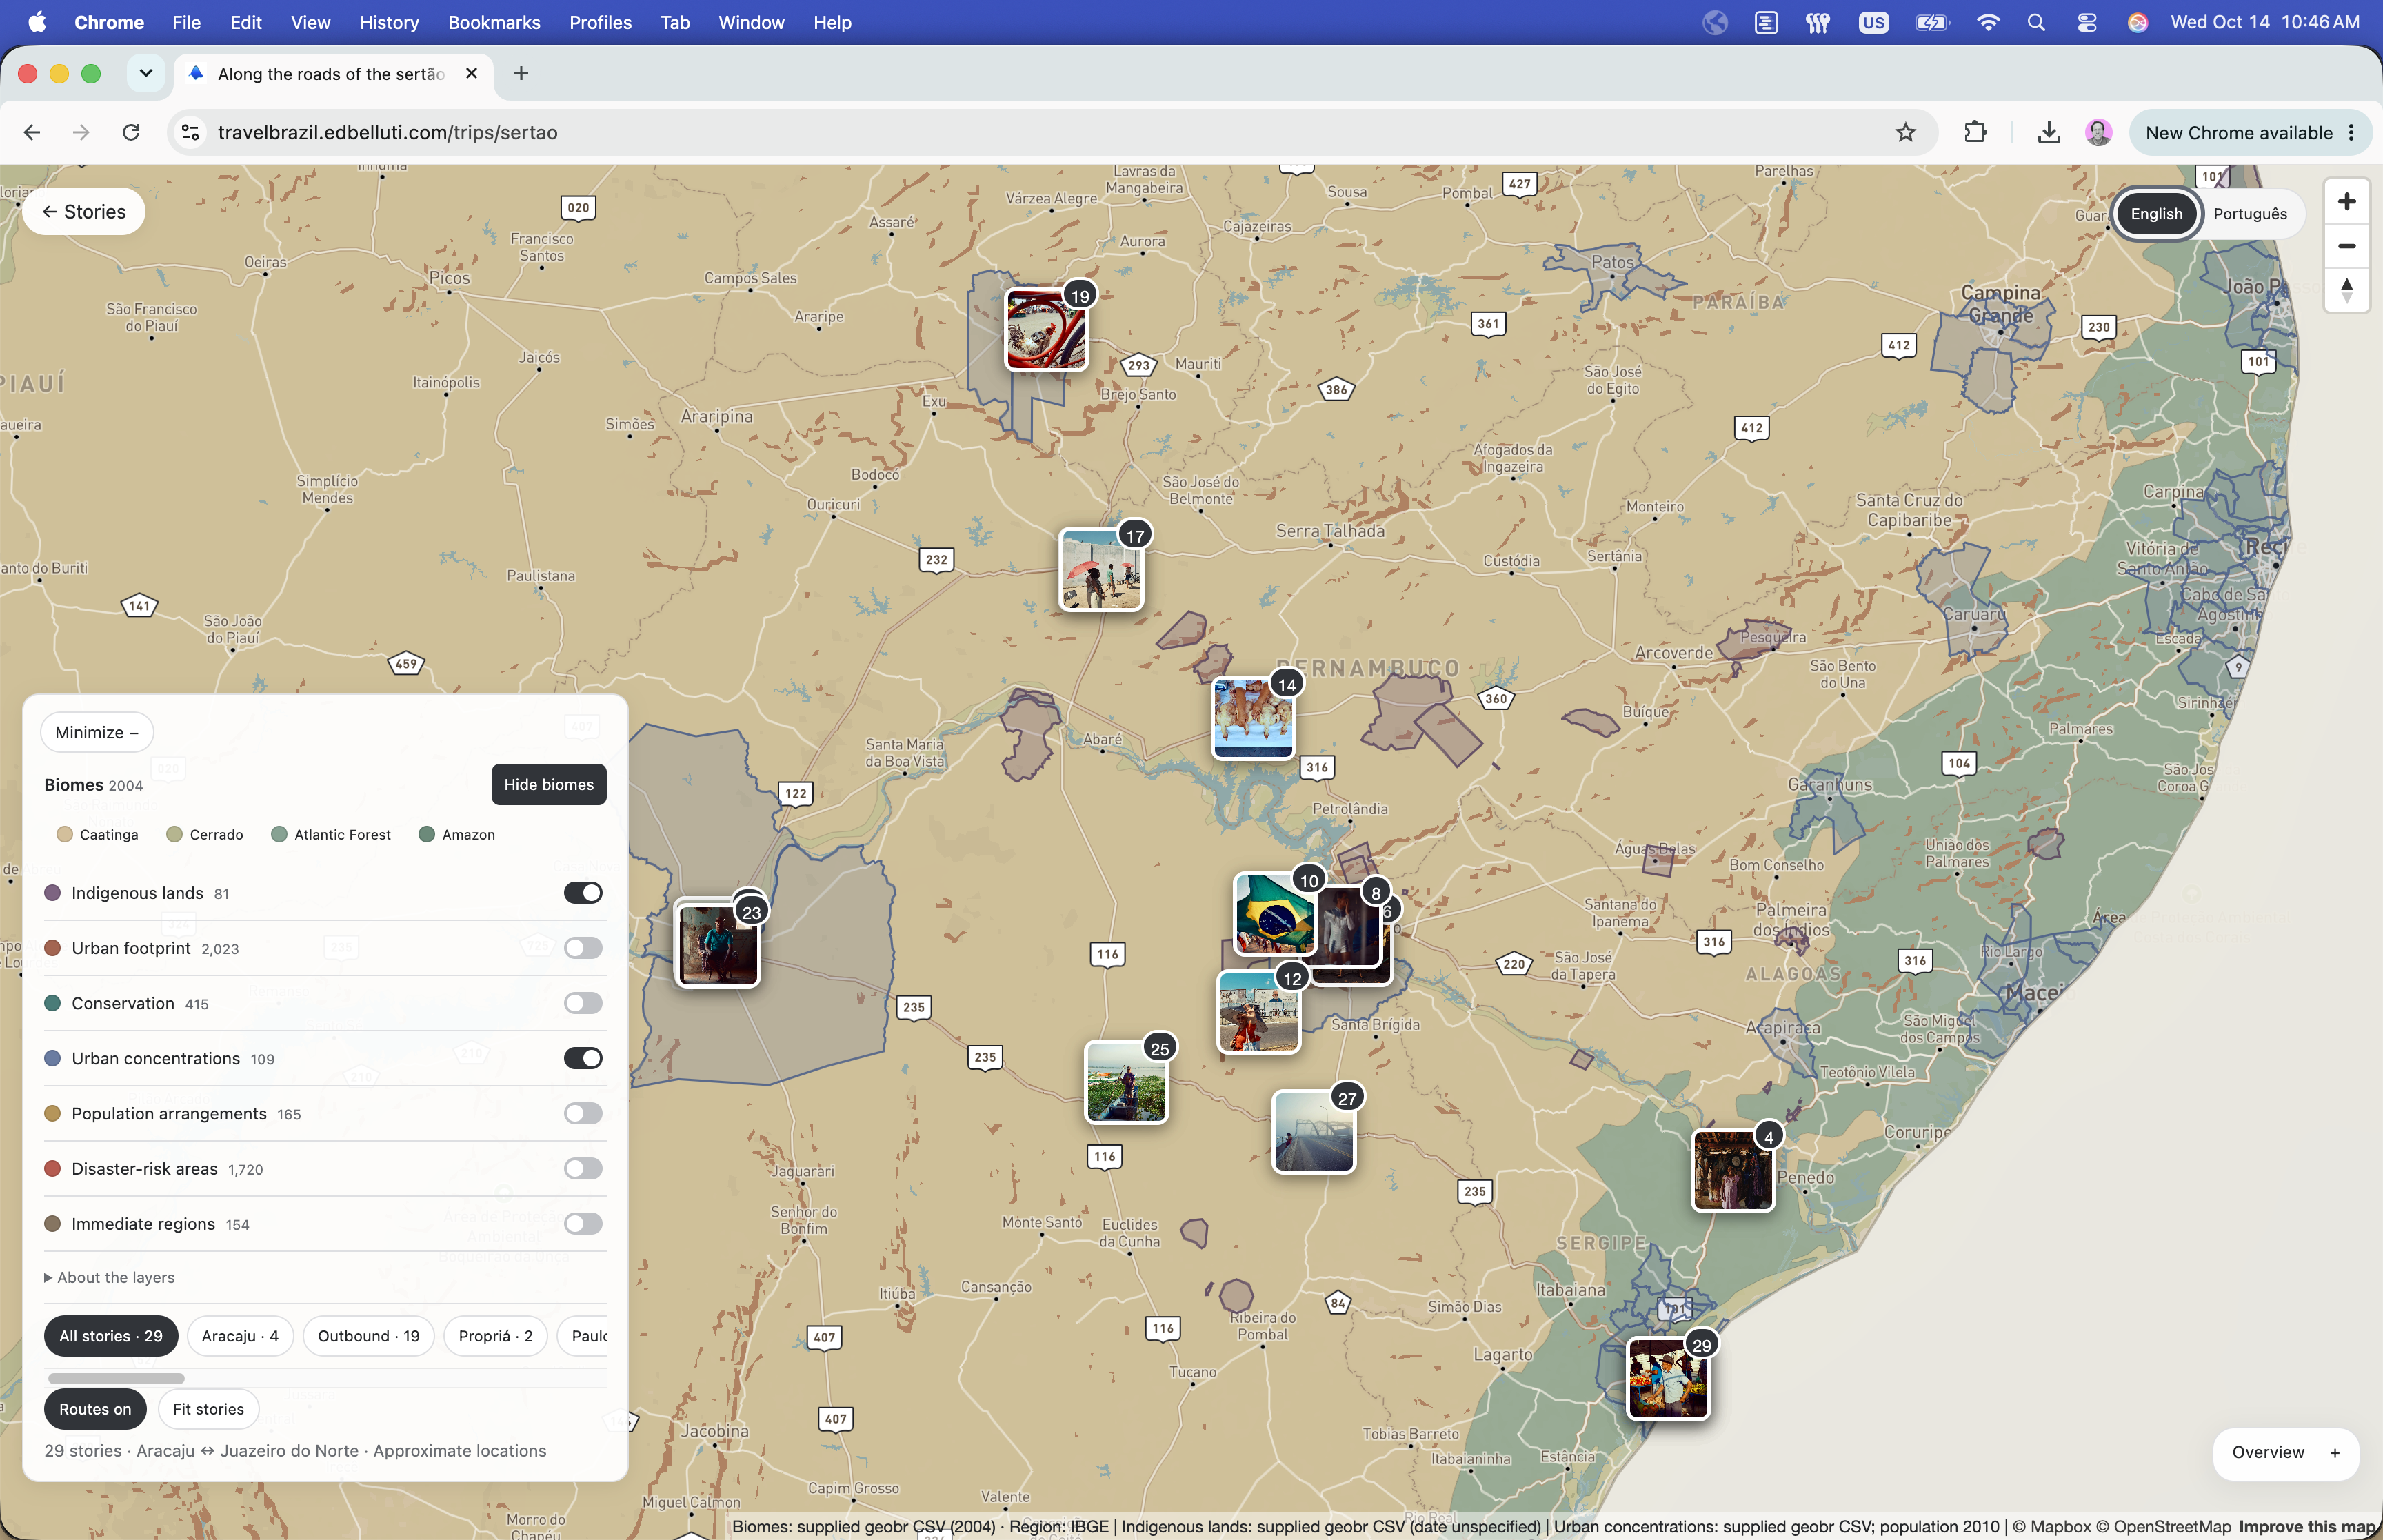
I built an interactive experiment that connects photographs and stories from Brazil to geographic and environmental data. The sertão journey follows the roads between Aracaju and Juazeiro do Norte. Its 29 stories become points of entry into a landscape that can be read through both images and mapped context.
Explore the photographs and map of the sertão journey.
A journey provides the organizing structure
The route gives the photographs a sequence and a relationship to one another. Places such as Paulo Afonso, Raso da Catarina, Canudos, and Juazeiro do Norte become part of a journey rather than isolated entries in an image gallery. Moving between the overview and individual stories lets the reader change scale: from a regional route to a particular place and back again.
That movement matters to me as a designer. A gallery supports looking closely. A map supports locating and comparing. Putting the two together creates a way to keep the image in view while asking a question about its surroundings. The geography gives context without taking over the story.
Public data changes what we can ask
The map includes layers for biomes, Indigenous lands, conservation areas, urban footprints, regional boundaries, and disaster-risk areas. Turning on a biome layer, for example, introduces the Caatinga as geographic context for the journey. Other layers invite questions about settlement, land use, and how administrative boundaries divide a continuous landscape.
These overlays are starting points for inquiry. A boundary can show that a story sits near a mapped region; it cannot explain the experience of everyone who lives there. A photograph is also a selective observation. Bringing the two together is useful when their different kinds of evidence remain visible.
The dates and locations are part of the story
Geographic data can look more current and precise than it is. The interface identifies the biome layer as a 2004 dataset and population figures as 2010 data. Other source dates are shown when available. Story locations are approximate, and the disaster-risk polygons are an undated source snapshot.
Those details shape interpretation. A historical layer can help explain how a place has been represented, but it does not describe its present condition automatically. Counts in the layer controls refer to extracted records. Naming what the data represents makes exploration more useful than a map that asks readers to assume every overlay is equally recent or complete.
Designing a conversation between image and place
English and Portuguese views, story filters, route controls, and optional layers provide several ways into the material. Someone can follow the road, browse a particular stop, or investigate the landscape around a photograph. The interface supports those paths without requiring everyone to begin with a technical question about the data.
This experiment connects two practices I enjoy: observing a place closely and building systems that help people understand context. Photography brings attention to the particular. Data opens a wider frame. The product lives in the movement between them.