
Mapping Andes Backcountry Ski
Planning a ski objective in the Andes starts with a different set of questions from planning a drive across town. Where is the mountain? How do you approach it? Which routes, access points, and nearby objectives belong in the same trip? A map can hold all of that information and still make it difficult to understand.
I built AndesMap to explore that gap: a geospatial tool for ski mountaineering and volcanic expeditions, organized around mountain travel. The interesting design problem was deciding which information deserved attention at each scale.
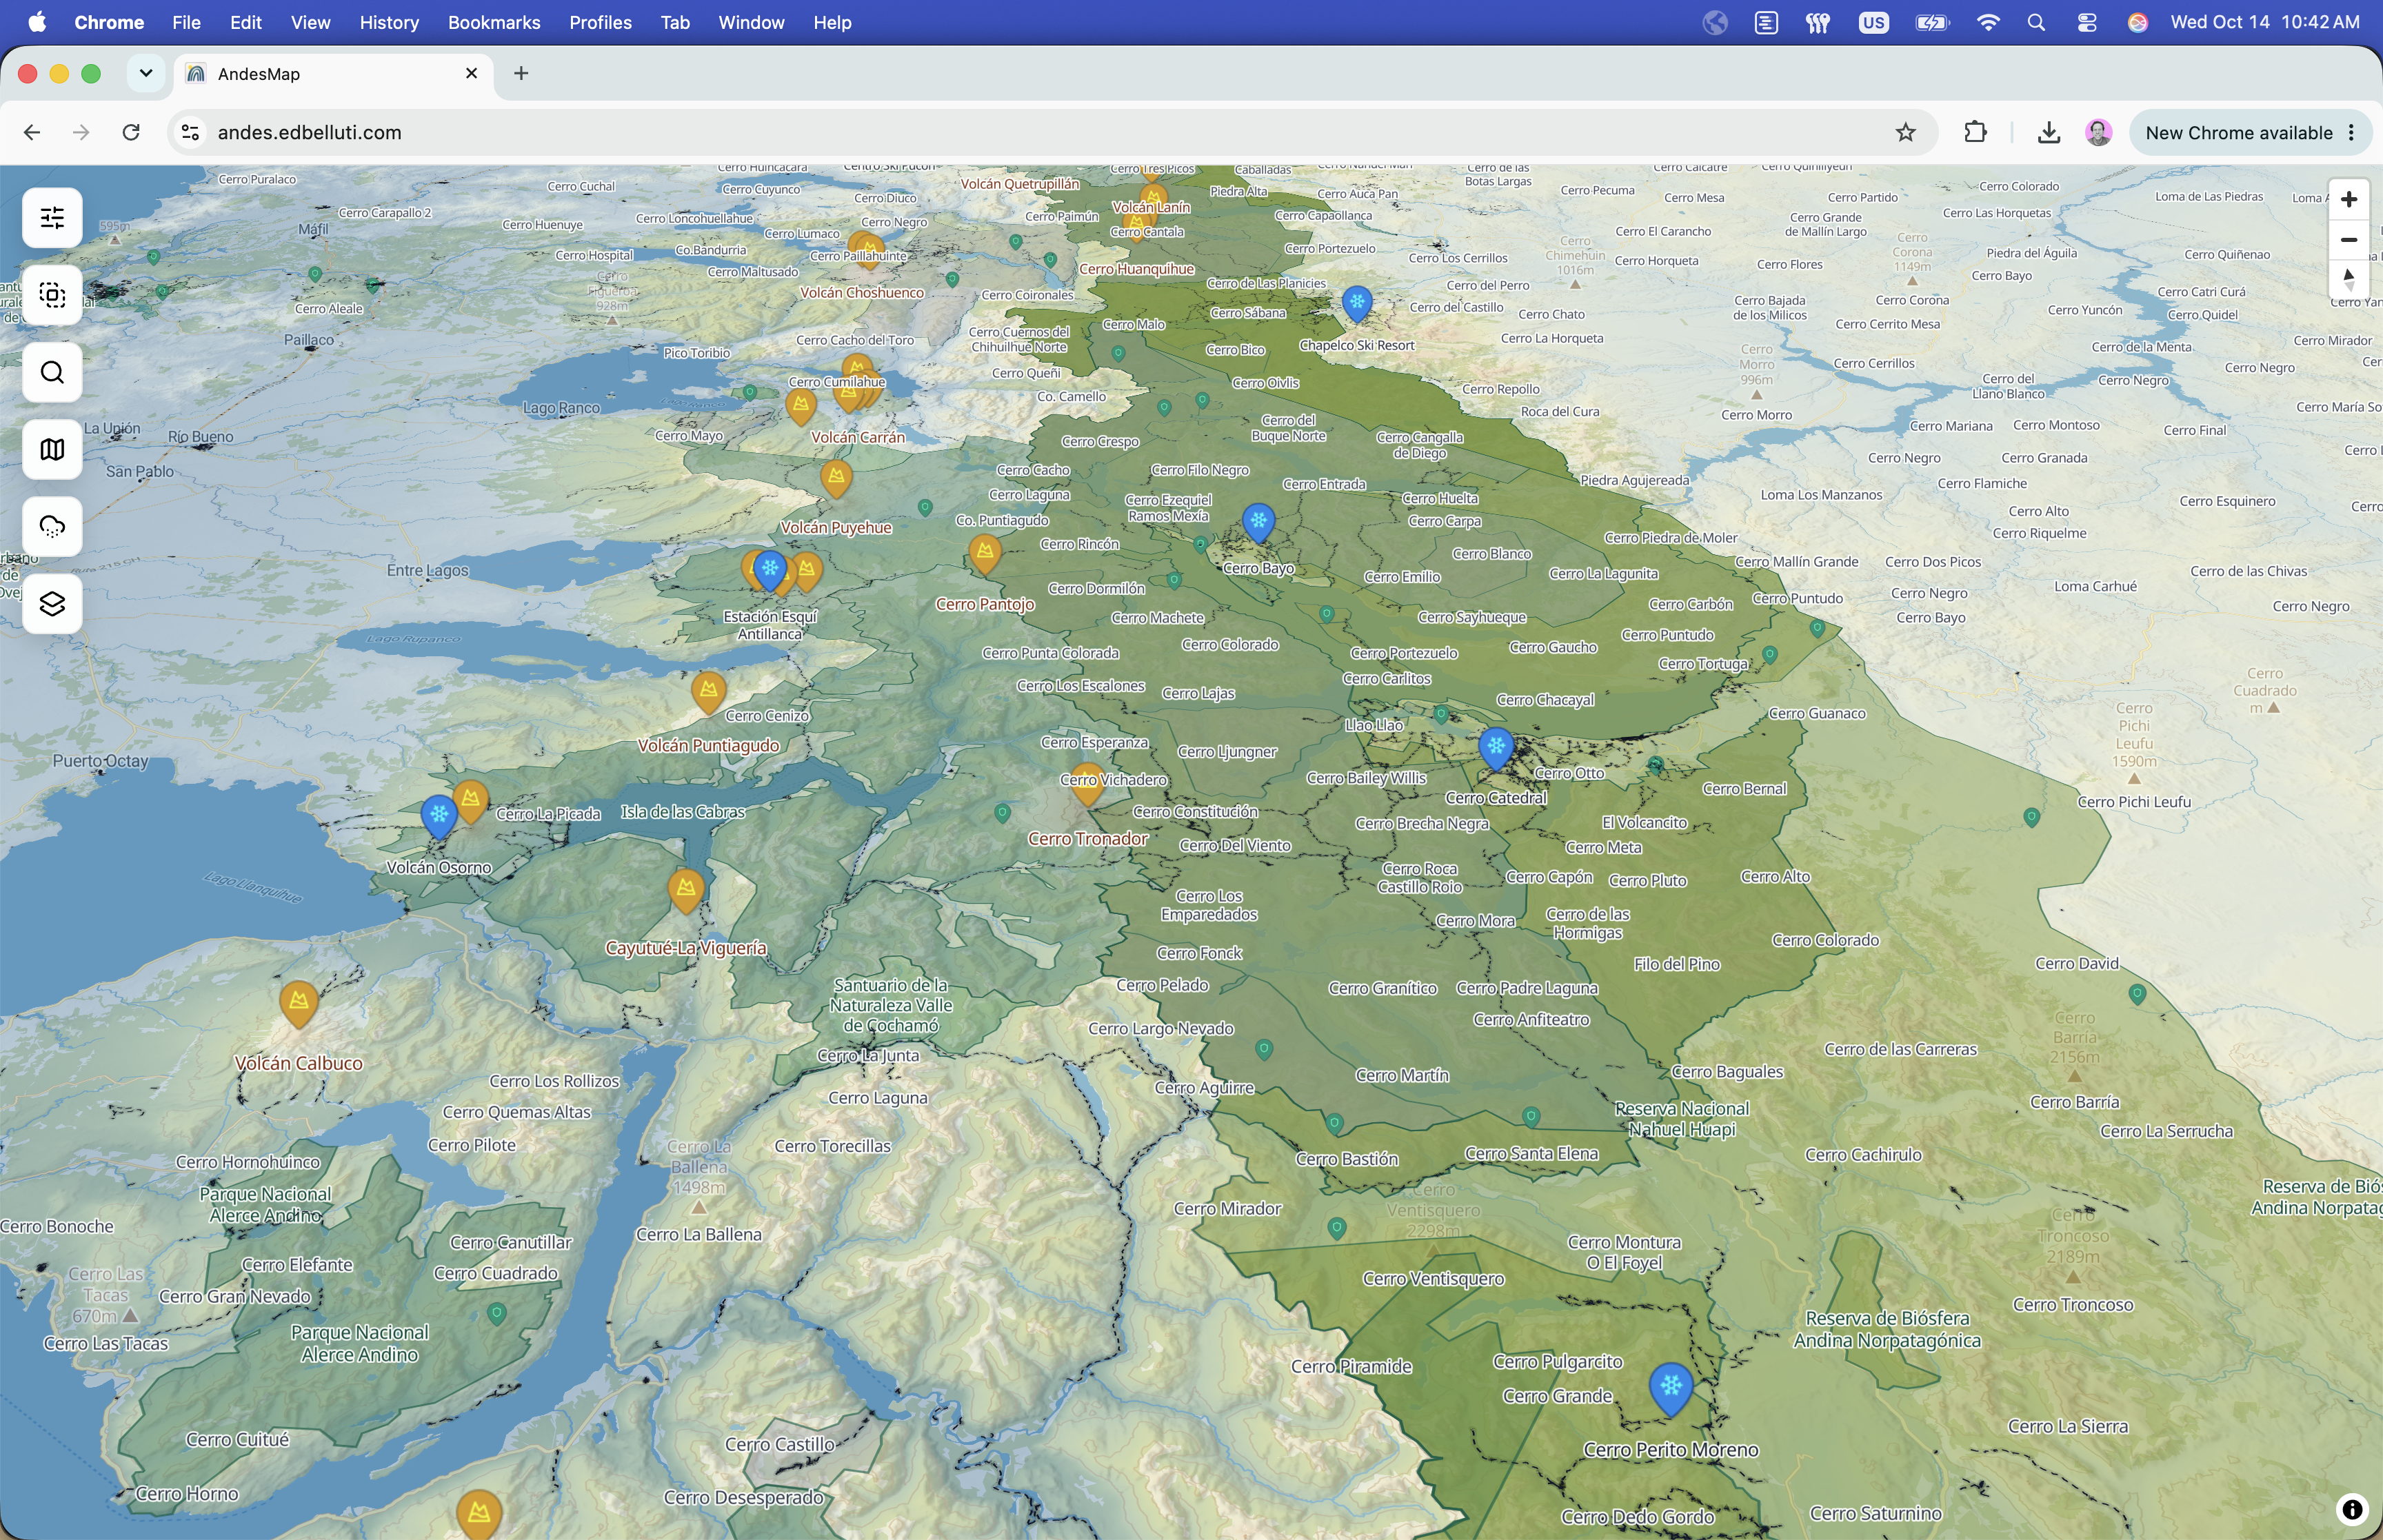
Explore the Andes backcountry ski map.
Start with the terrain and the question
General-purpose maps give roads, businesses, and labels a lot of visual weight. Those priorities make sense for everyday navigation. In the mountains, I want to understand how an objective sits within the landscape before examining the details of an approach.
That changes the hierarchy. Peaks and volcanoes become reference points. Routes describe possible movement through the terrain. Parking and access points connect an alpine objective to the practical beginning of a trip. Protected areas add another layer of context. Each answers a different question, and showing them all with equal emphasis makes the map harder to read.
Detail should arrive when it becomes useful
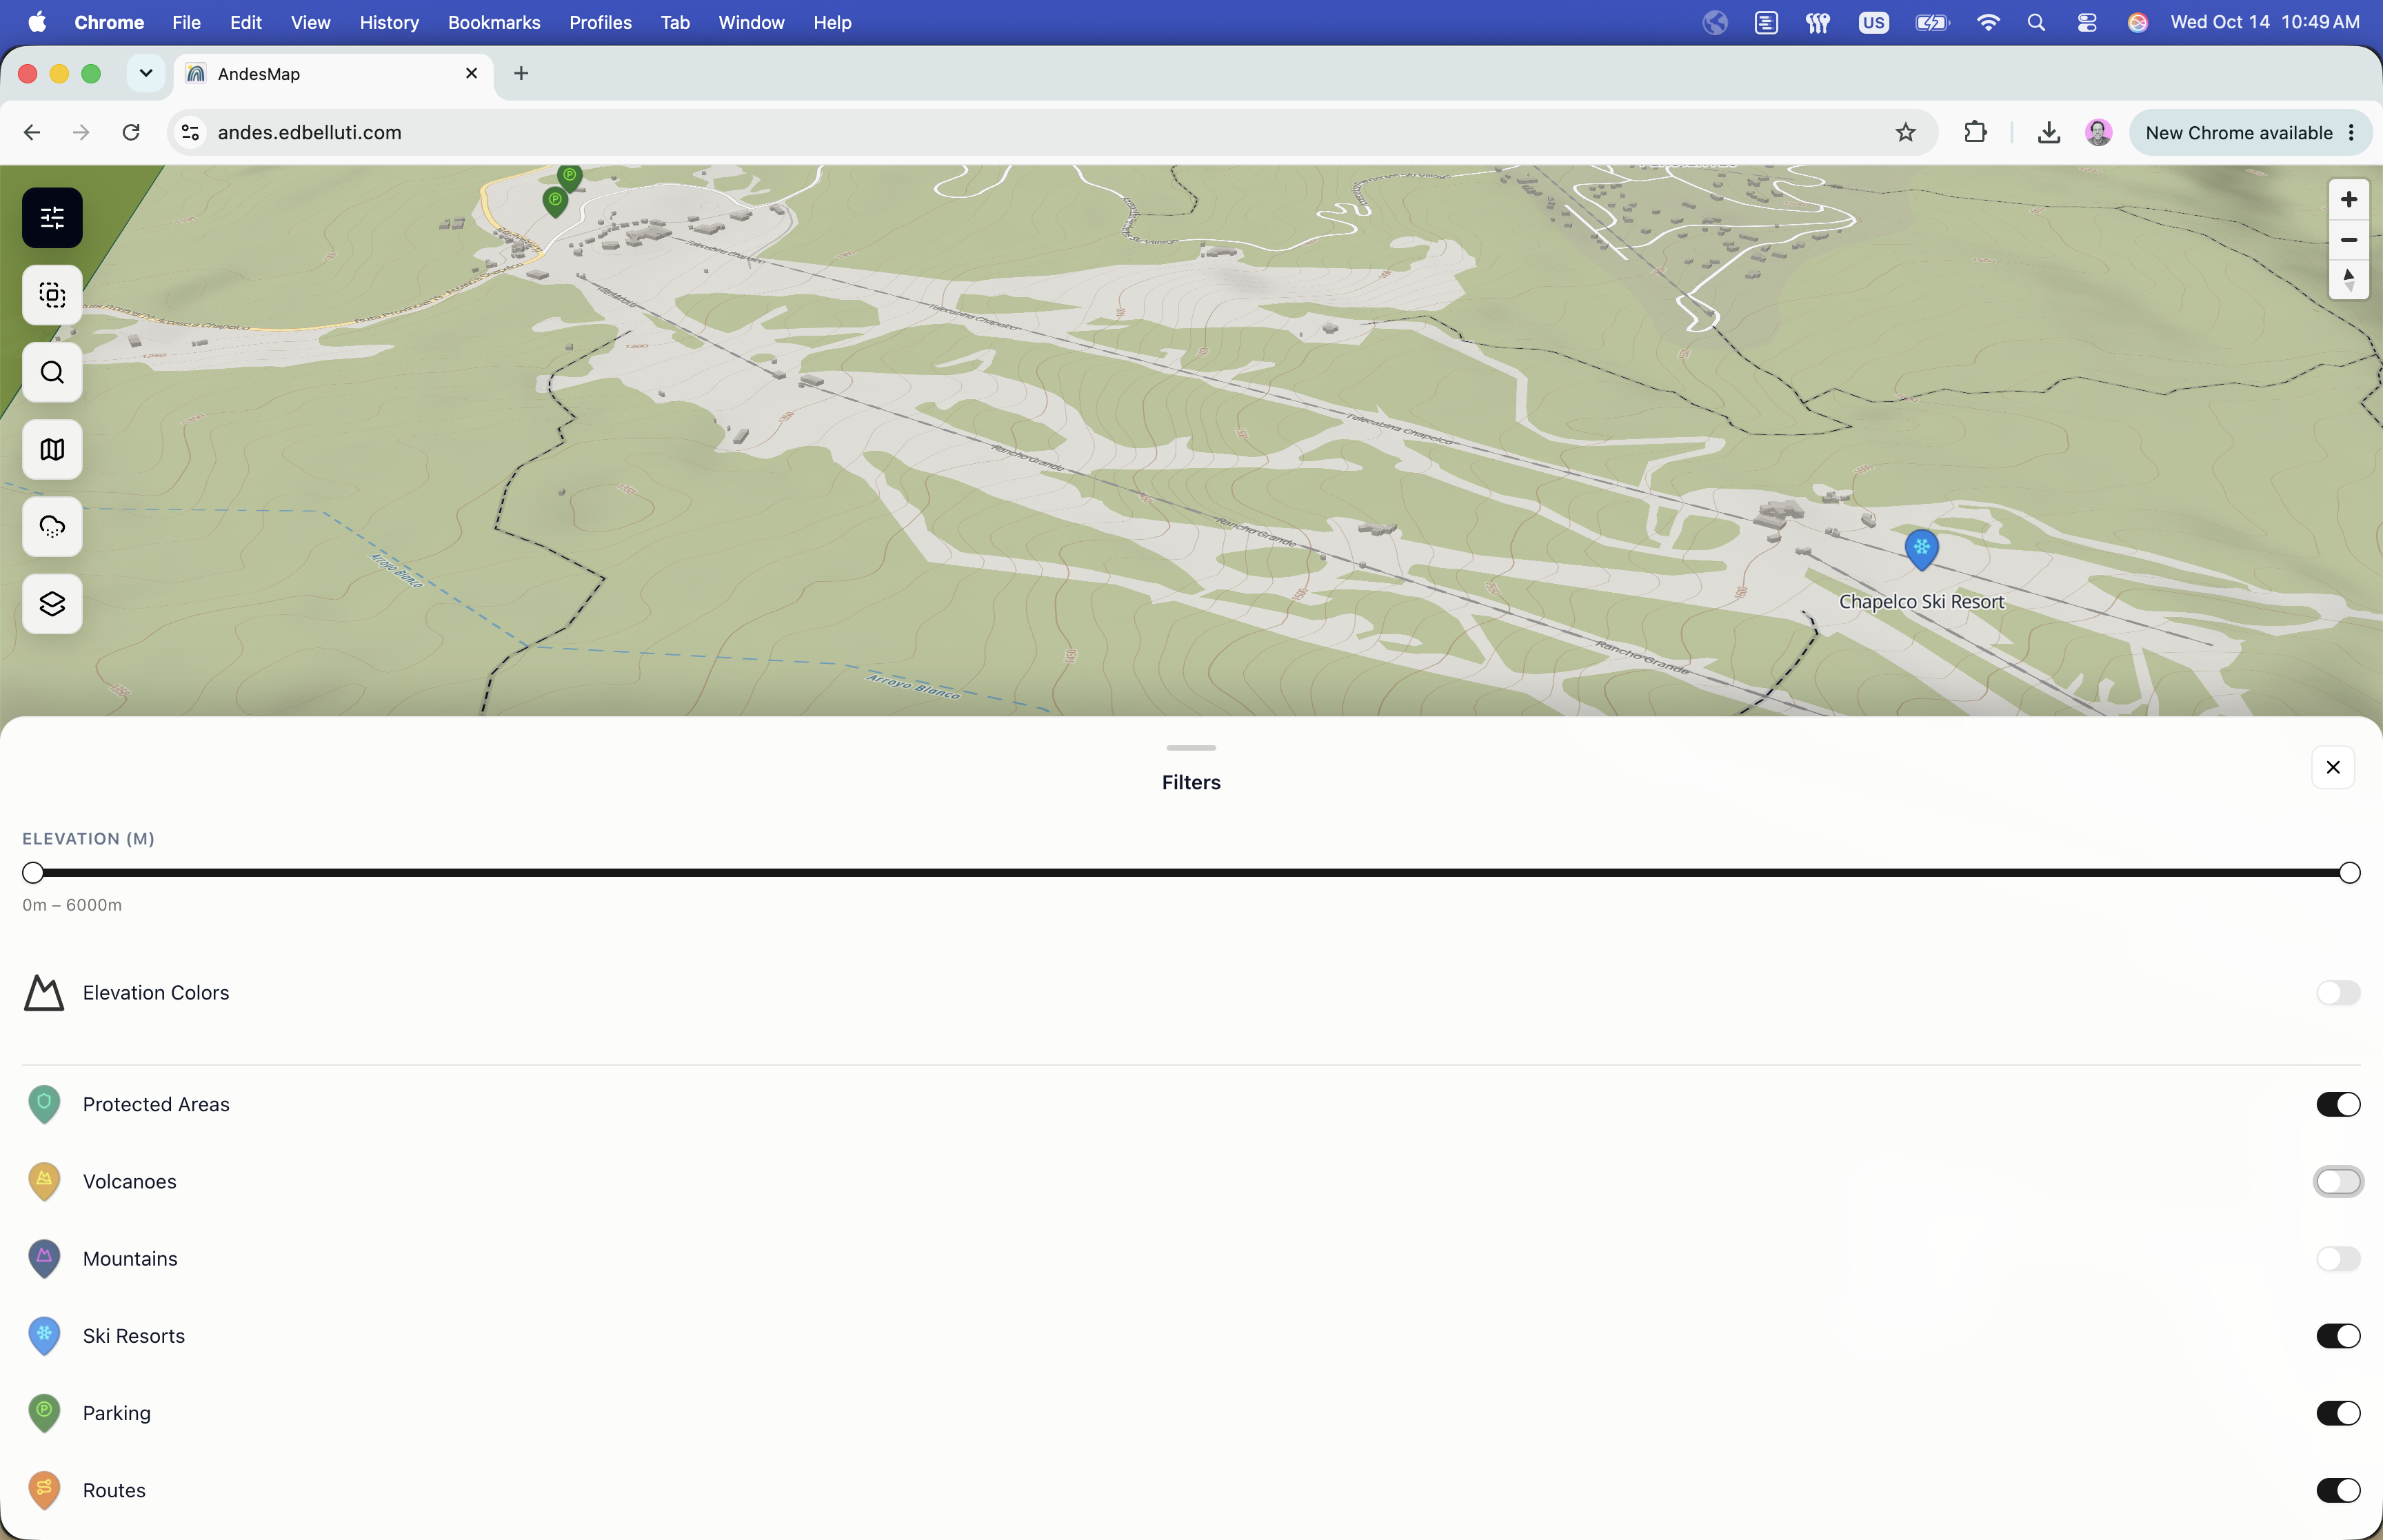
My guiding principle was a quiet overview with detail available on demand. At a regional scale, the map should help someone orient themselves. As they move toward a particular objective, labels and route information become more useful. Layer controls let the reader choose which questions to investigate.
Small decisions accumulate here: when a label appears, how large an icon feels, whether two labels collide, and how much contrast a route needs against the terrain. A map becomes legible through those relationships. Adding another layer is only useful if the reader can distinguish it from what is already there.
Geospatial work made the design concrete
MapLibre GL and vector and raster layers gave me control over the map's presentation. Working directly with the rendered terrain also made problems visible quickly. A repeated label or a route that disappeared against the background was immediate feedback about a styling decision.
The earlier snow-layer experiment, based on ERA5 data, raised a related question: what does a reader assume when environmental information appears on a map? The time period and resolution matter. A layer can help frame regional conditions while remaining too broad to answer a question about a specific slope or day. Those distinctions belong close to the information people are interpreting.
The useful outcome is a better next question
I think of AndesMap as a place to begin understanding a region and comparing objectives. The map helps organize the research that comes next: access, conditions, local knowledge, and the details of a particular trip.
The project reinforced something I see in product design more broadly. An interface earns its complexity when each additional piece of information helps someone make a more informed decision. In this case, the landscape provides the structure, and the interface helps people read it.