Turning Medicare Rules Into Product Logic
Summary
I designed this RPM billing and communication experience to make Medicare requirements easier to navigate for both patients and clinicians.
The work sat between care delivery, Medicare policy, device reliability, and product architecture, so the system had to support care teams and billing at the same time.”
Overview
Role: Lead Product Designer + Technical Architect
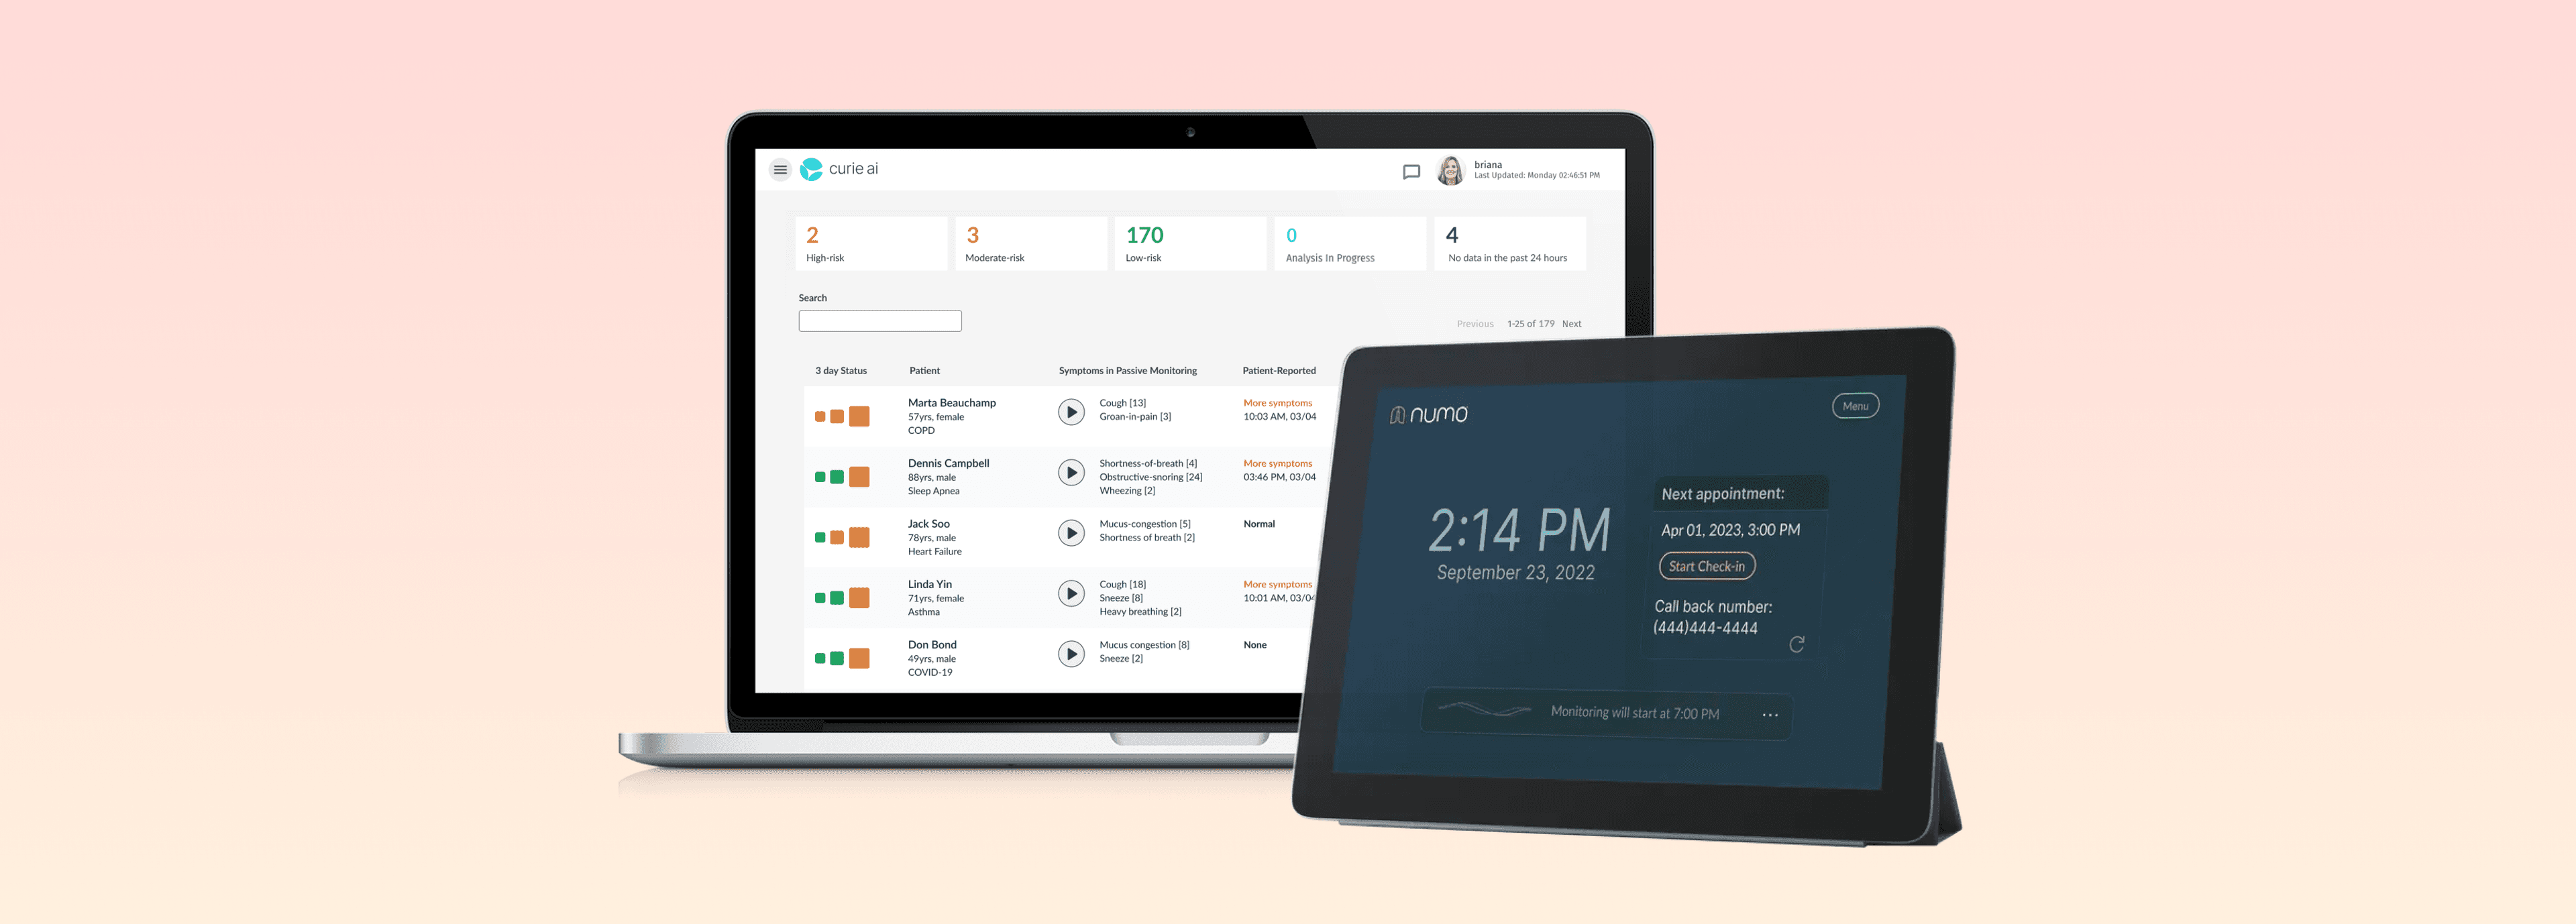
Patients and clinicians needed clearer, consistent communication channels and data display. Existing messaging tools were disjointed and lacked contextual clarity across stages of care. Additionally, the technical infrastructure for capturing, validating, and routing pulse oximeter data needed to support both real-time clinical alerts and Medicare billing compliance.
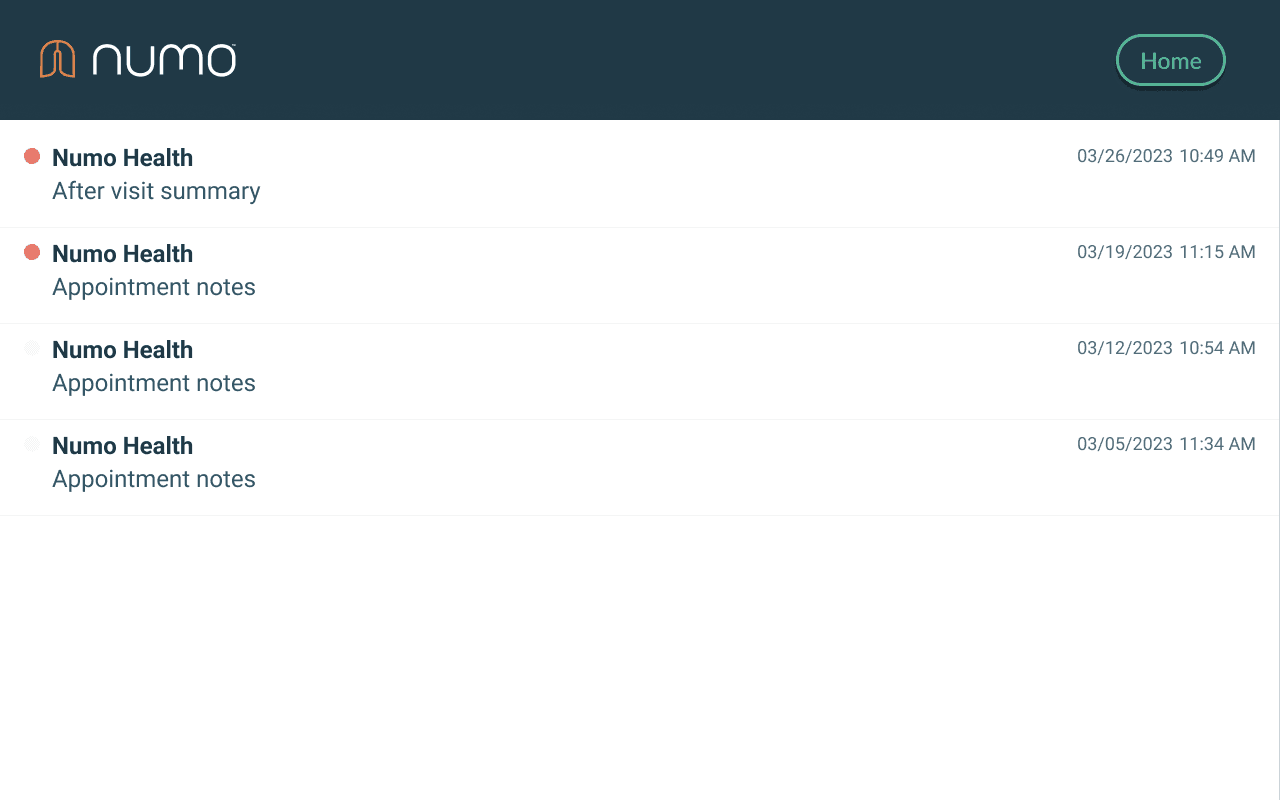
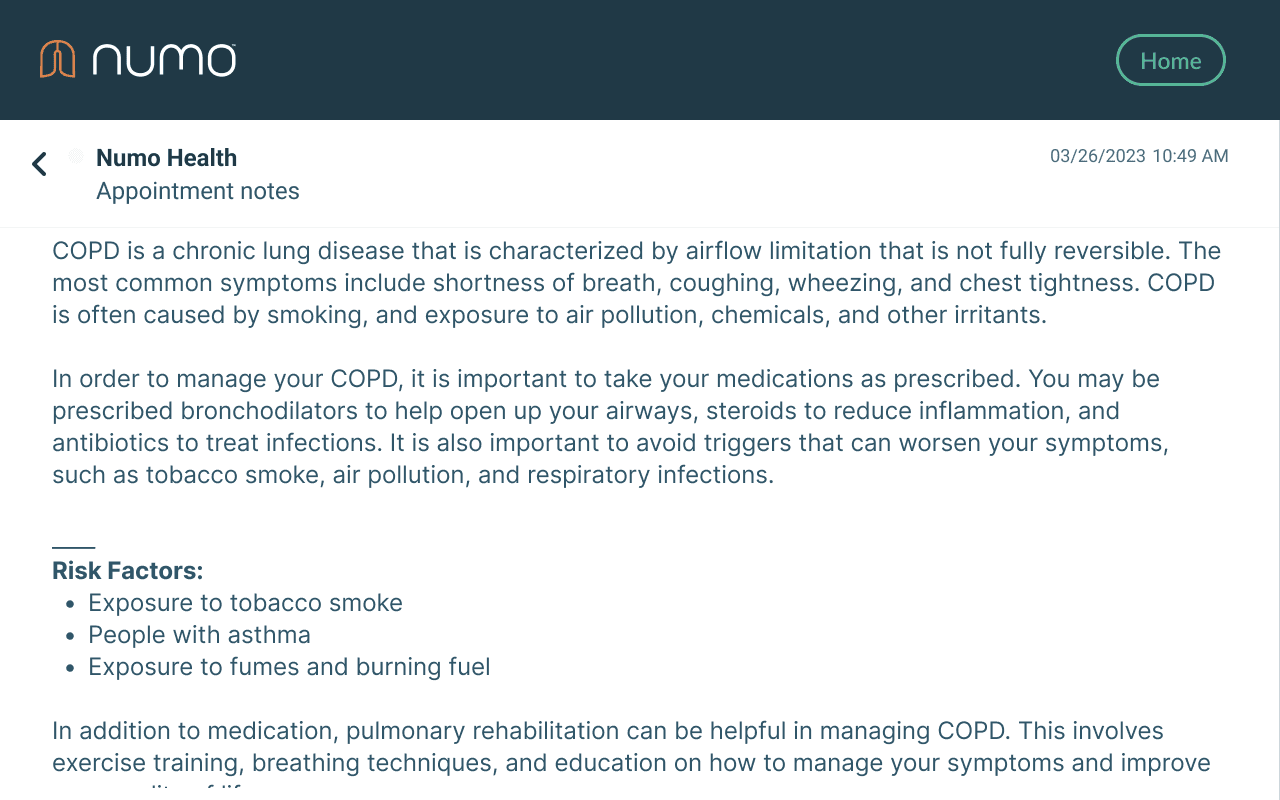
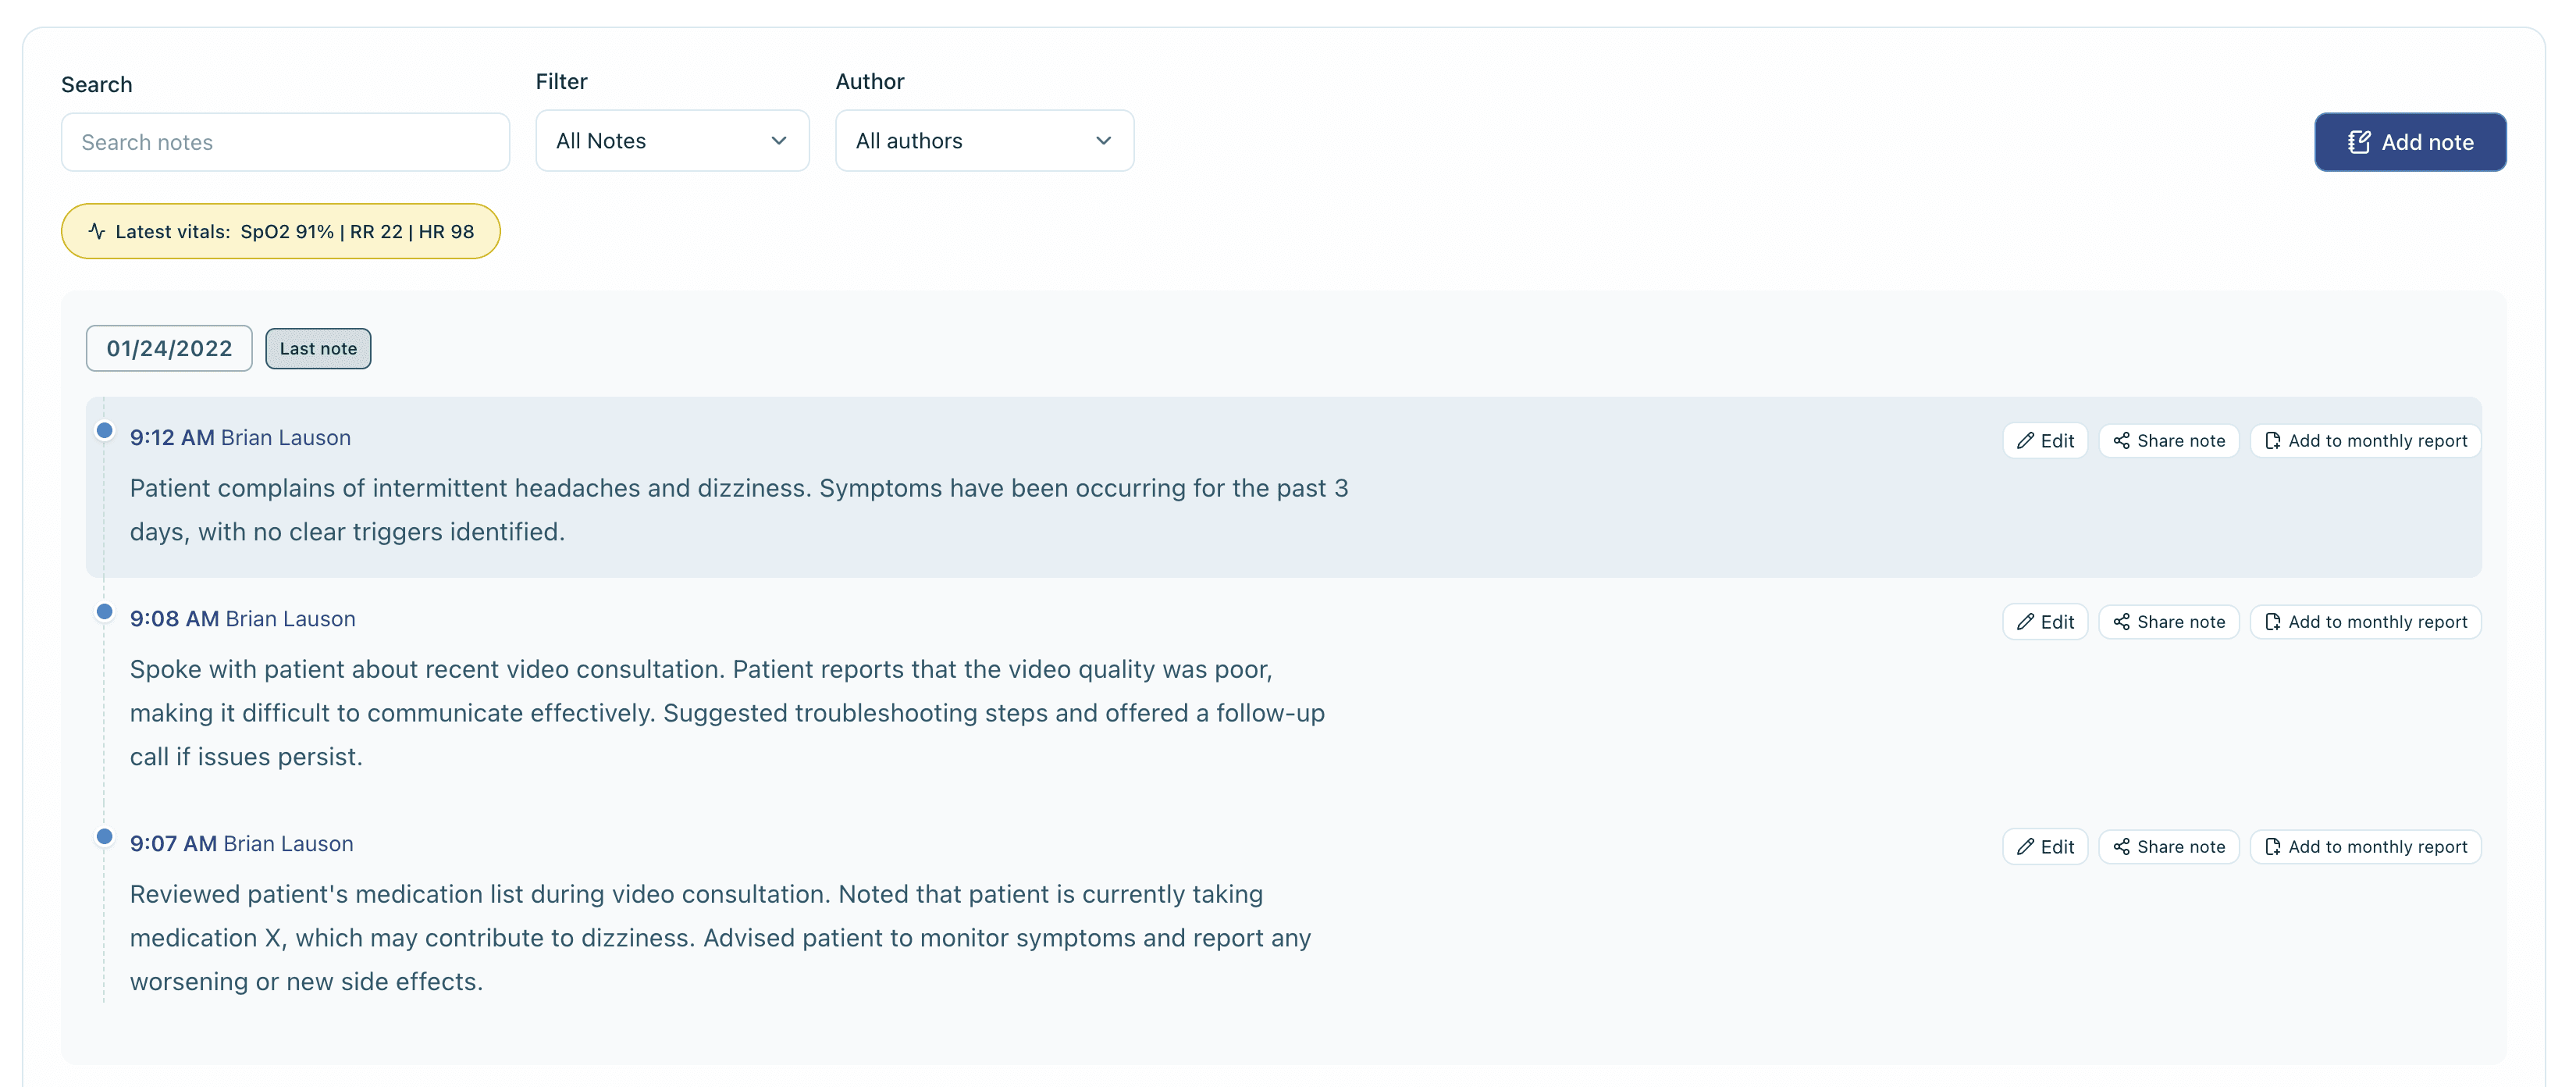
Communication patterns spanning patient messages and structured clinical notes.
View interactive prototype →
Impact
This work improved both the business side of RPM operations and the patient experience, making the system easier to trust, easier to use, and more dependable to bill against.
Business
- Higher retention in monitoring programs
- Fewer support escalations
- Better coordination across care workflows
- 30% improvement in billable readings
Patients
- Increased clarity and trust in communication
- Reduced confusion from fragmented messages
- Improved engagement with care updates
- Reliable data transmission
Story
Remote Patient Monitoring (RPM) is about collecting the right data, at the right frequency, and in the right format to support both care and compliance. At Numo Health, I led the design of a system to help patients record oxygen saturation levels at home using a Bluetooth pulse oximeter. Our goal was to not only enable real-time monitoring but also meet strict Medicare billing requirements tied to the number and type of readings collected each month.
Patient Layer
System Layer
Clinical Layer
Strategy
RPM billing through Medicare requires a specific number of validated vitals readings per patient, per month. These requirements were not always well understood across the tech and product teams, so I took the lead in translating clinical policy into product design and technical architecture.
- Mapped Medicare billing criteria to specific patient behaviors and system events
- Designed the end-to-end data flow from Bluetooth device → tablet → cloud → dashboard
- Built data monitoring infrastructure to track adherence patterns
- Identified and resolved technical barriers to successful readings
- Created real-time alert systems for both clinical and technical issues
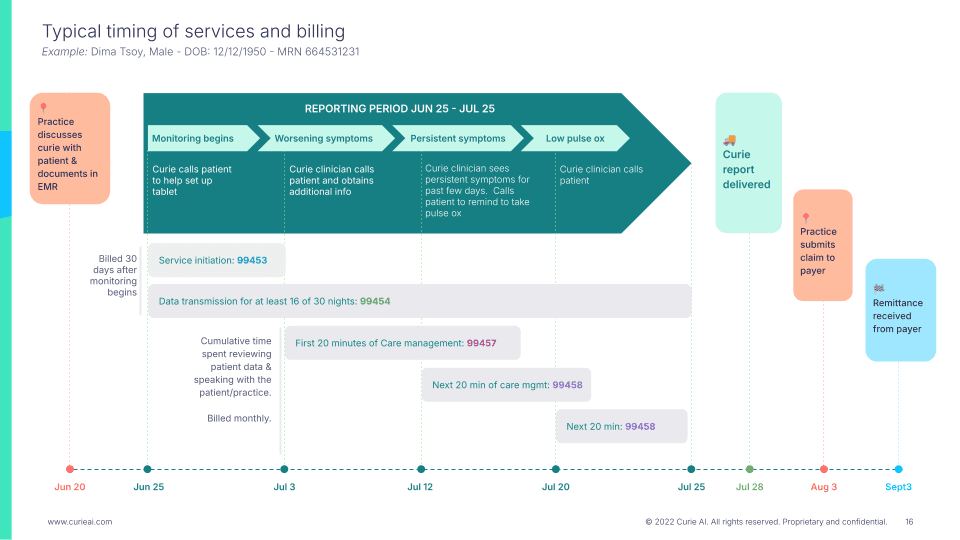
Mapping Medicare Billing to Curie AI Patient Care
Architecture
Technical Architecture
Technical Architecture
Before designing interfaces, I built the calculation engine in Python to understand system constraints and validate Medicare billing logic. This V0 implementation became the foundation for the automated billing infrastructure now used across programs.
(1) Data Aggregation
   ↓
(2) CPT Code Logic
   ↓
(3) Duplicate Prevention
   ↓
(4) ICD-10 Integration
   ↓
(5) Financial Projection
5 stages of the billing data pipeline
Tech Stack
- Python 3.x — Core scripting language
- Pandas — Data aggregation and transformation
- Medicare CPT Codes — 99453, 99454, 99457, 99458, 99426, 99427
1. Data Aggregation
Combined multiple data sources — clinical review logs, device transmissions, and communication minutes — into a unified billing dataset.
# Example Pandas workflow
vitals = pd.read_csv("Daily Patient Pulse Oximeter Data.csv")
coaching = pd.read_csv("Curie Coach Time Spent.csv")

# Filter data for billing period
vitals = vitals[vitals['date'].between('2024-01-01', '2024-01-31')]

# Group by patient and count unique transmission days
readings = vitals.groupby('patient_id')['date'].nunique()

# Merge coaching minutes
merged = readings.to_frame().merge(coaching, on='patient_id', how='left')
2. CPT Code Logic
if transmission_days > 15:
    codes = ["99453"]
    if total_minutes >= 120:
        codes += ["99454", "99457", "99458", "99426", "99427"]
    elif total_minutes >= 90:
        codes += ["99454", "99457", "99458", "99426"]
    elif total_minutes >= 60:
        codes += ["99454", "99457", "99458"]
    elif total_minutes >= 40:
        codes += ["99454", "99457"]
    elif total_minutes >= 20:
        codes += ["99454"]
elif enrolled_in_longitudinal == "Y":
    if total_minutes >= 60:
        codes = ["99426", "99427"]
    elif total_minutes >= 30:
        codes = ["99426"]
3. Duplicate Prevention
- Cross-referenced historical
99453.csvto avoid duplicate setup charges - Maintained state across billing cycles using persistent tracking files
- Replaced already-billed entries with “0” placeholders for audit clarity
4. ICD-10 Integration
Linked clinical diagnoses from patient records to CPT billing codes, ensuring each claim carried medical justification for compliance.
5. Financial Projection
fee_schedule = {
  "99453": 17.01,
  "99454": 44.71,
  "99457": 45.31,
  "99458": 37.13
}

merged["reimbursement"] = merged["code"].map(fee_schedule)
summary = merged.groupby("code")["reimbursement"].sum()
summary.to_csv("claims_summary.csv")
Output included individual CSVs per CPT code, total claims, and estimated reimbursement values — enabling accurate revenue forecasting.
Key Technical Decisions
- Data normalization: Threshold logic for minimum billing units and session caps
- State management: Persistent
99453.csvto prevent duplicates across cycles - Edge cases: Mid-month enrollments, transmission gaps, Bluetooth failures, and multi-service overlap
- Performance: Pandas
groupby()and vectorized operations for patient-level aggregation
UX
I designed a step-by-step UI guiding patients through taking a reading with the provided pulse oximeter. Readings were validated locally, synced to the cloud, and visualized in clinician dashboards with real-time alerts for unsafe values.

Live readings, confirmation messages, and connection feedback.
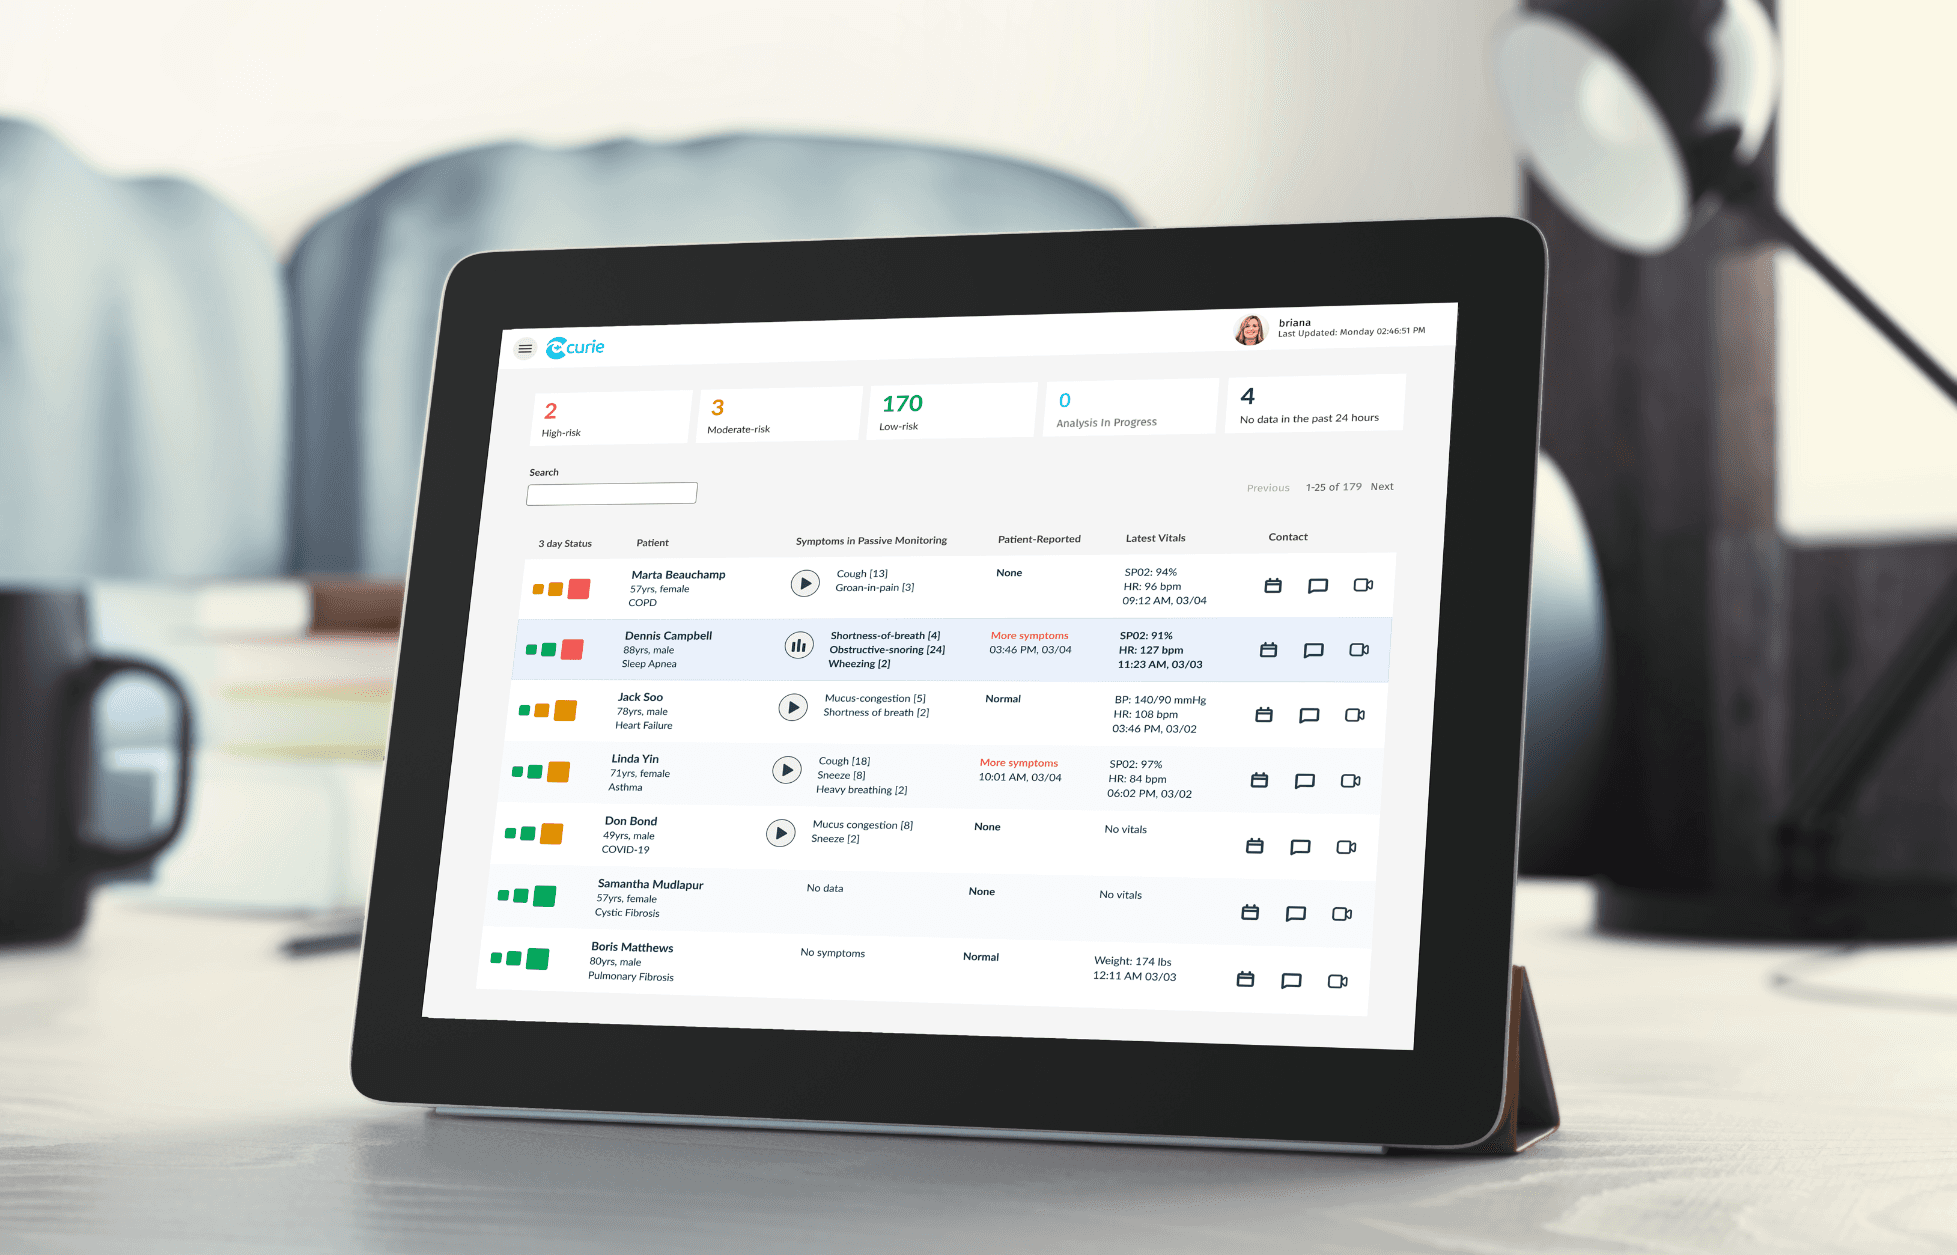
Vitals flowing into the clinical software.
Clinical experience prototype.
View interactive prototype →
Alerts and Messaging
I designed the clinical experience to surface high-risk events quickly while keeping related messaging and follow-up actions close at hand. Alerts were organized by severity and recency so clinicians could review, respond, and take action without losing context.
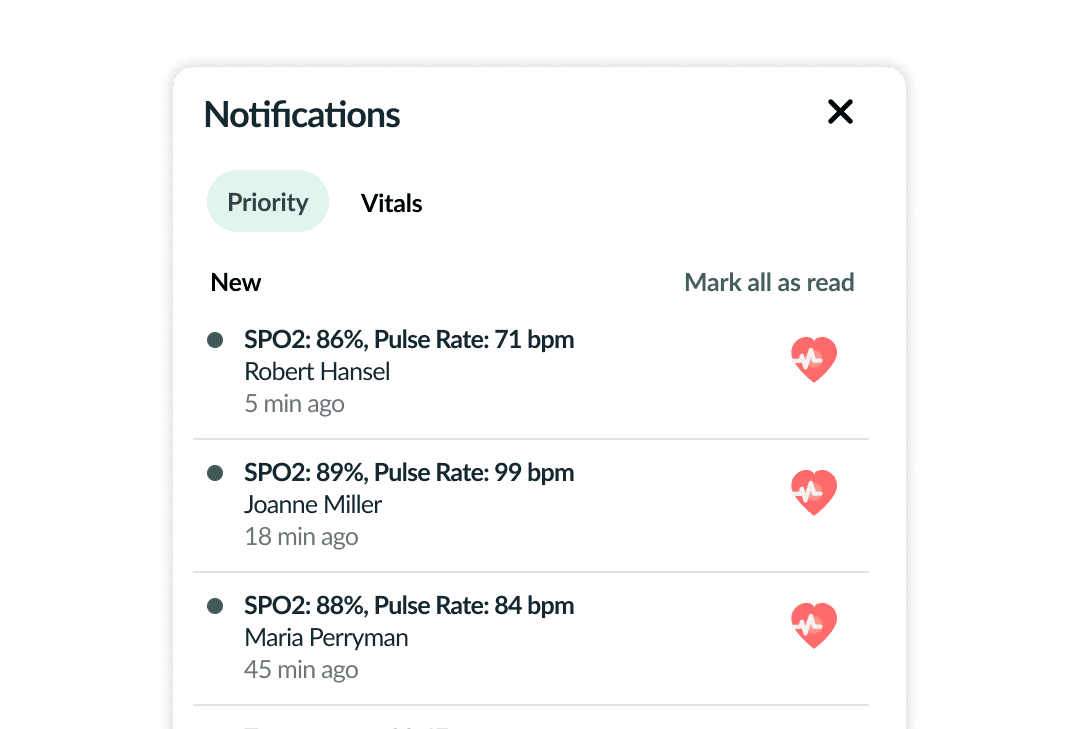
Notifications were prioritized to help clinicians spot risk quickly without adding alert fatigue.
View notifications prototype →
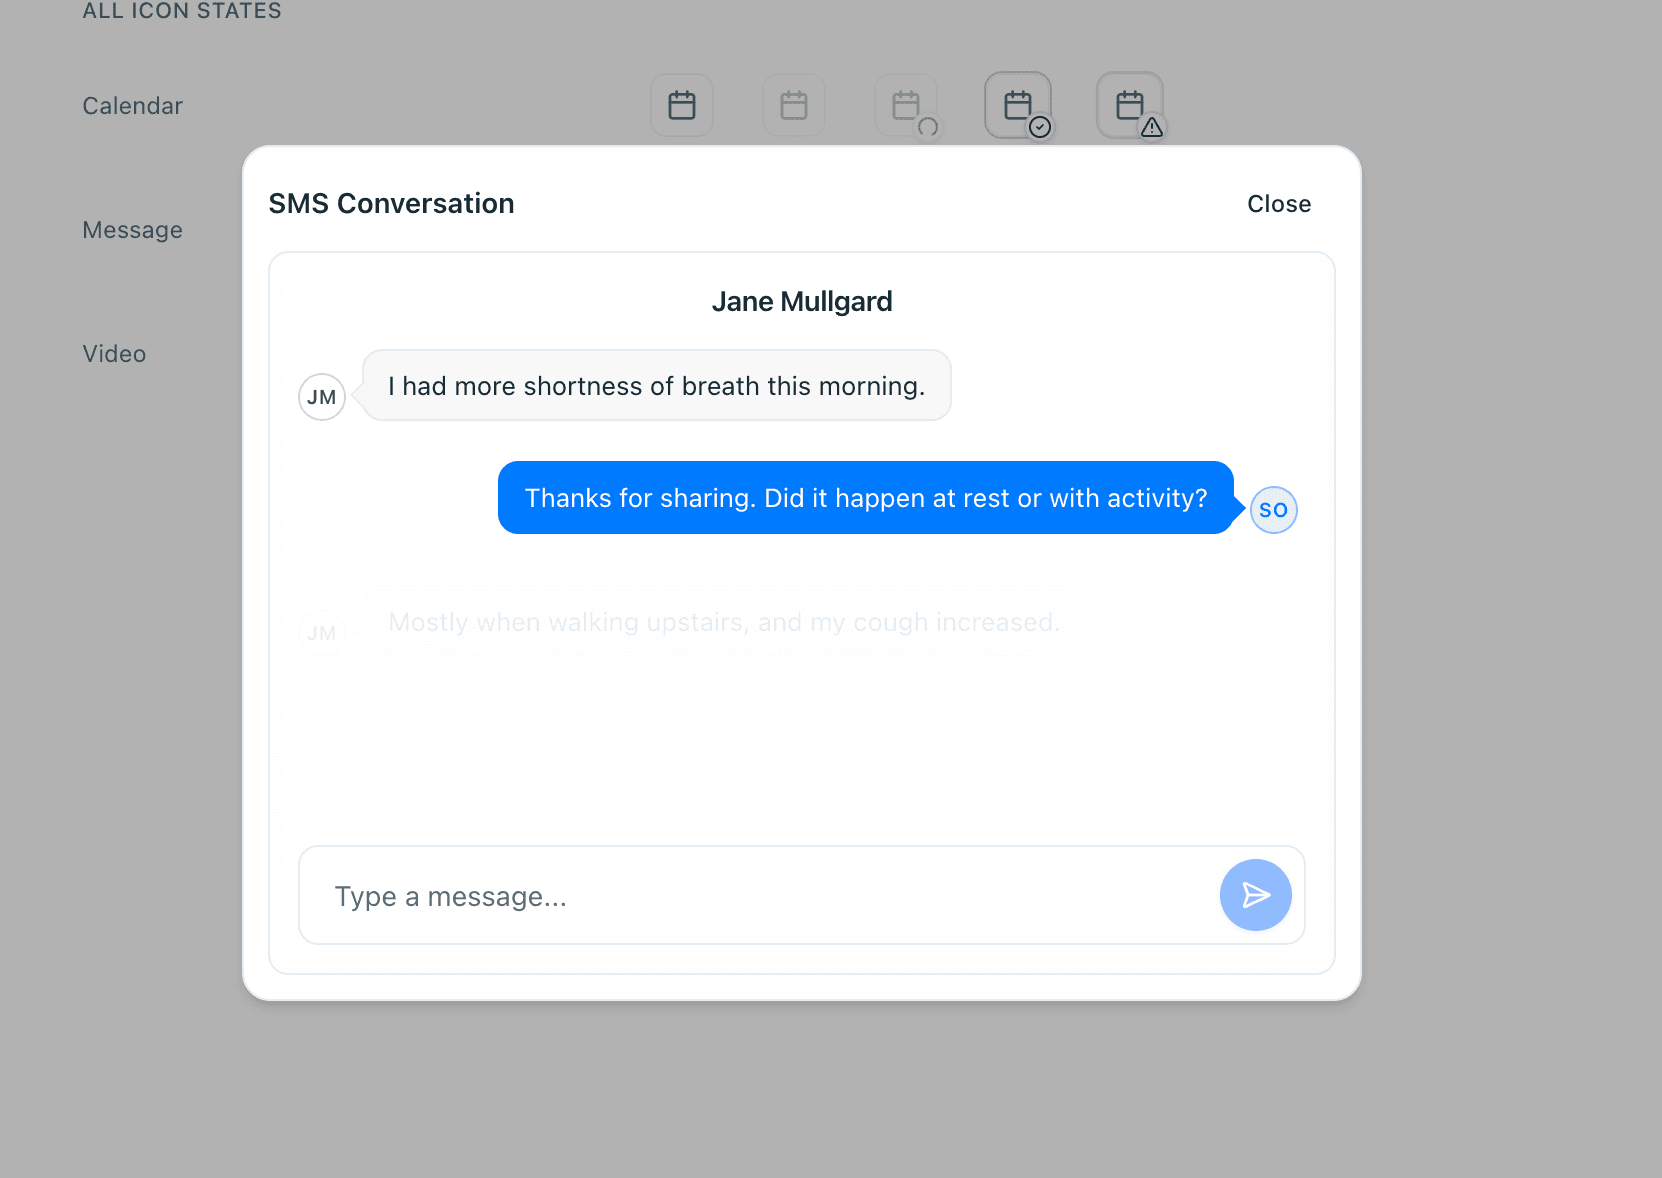
Messaging patterns stayed connected to the alert workflow, giving clinicians a faster way to review and respond.
View messaging prototype →
Support
An in-app Tech Support Call trigger connected patients directly to a monitored Slack channel. This surfaced hidden issues — like Bluetooth disconnects — enabling rapid investigation and fixes that improved reading success rates by 30%.
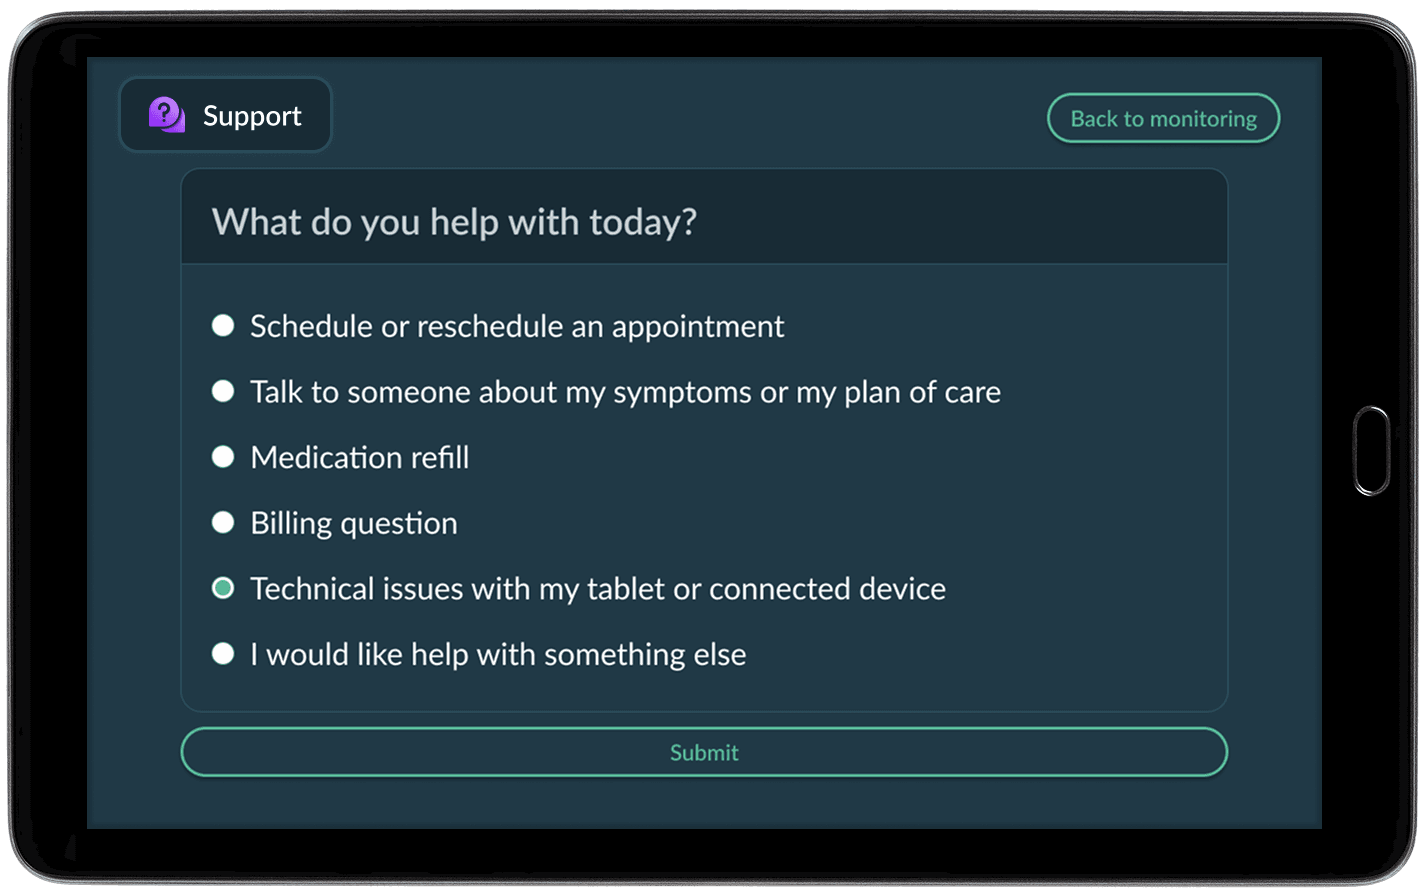
Support path for patients.
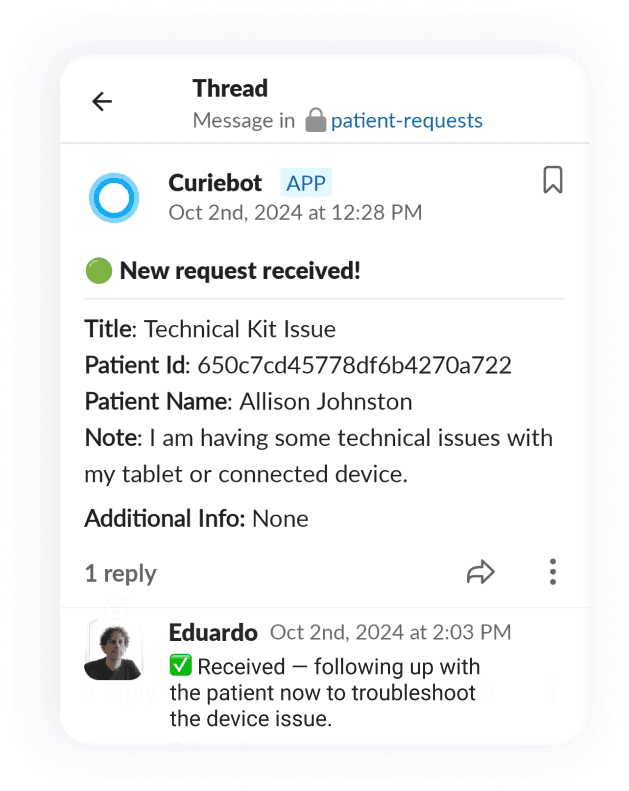
Requests flowed directly into Slack for triage.
Outcomes
- 30% increase in successful pulse oximeter readings
- 66% reduction in Bluetooth connection failures
- 99% data accuracy through layered validation
- Reduction in clinician alert fatigue
- 40% more patients eligible for Medicare RPM billing